MCert User Guide
This guide covers every page in MCert: how to scan your servers and workstations and network devices and reach every layer of cryptography they use. That runs from the network down to the filesystem layer.
Key concepts
Four ideas come up on nearly every page in MCert. Learn these first and the rest of the product reads itself.
PQC status
Every cryptographic finding lands in one of four buckets. Each one is shown as a coloured pill wherever it appears:
| Status | Meaning | Real examples |
|---|---|---|
| SAFE | Quantum-resistant and acceptable today | AES-256 · SHA-256/384/512 · ML-KEM · ML-DSA |
| TRANSITIONAL | Acceptable now. Migrate before 2030. | RSA-2048 · ECDSA P-256 · TLS 1.2 |
| DEPRECATED | Weak. Schedule replacement. | SHA-1 · 3DES · Blowfish · RSA-1024 |
| UNSAFE | Broken. Fix immediately. | MD5 · MD4 · MD2 · DES · RC4 · NULL · SSL 2.0/3.0 |
Migration priority
Every finding also gets a priority score from 0 to 100. That tells you what to fix first. Critical is 90 and above. High is 70 to 89. Medium is 40 to 69. Low is under 40.
Scan lenses
Every scan job looks at a host from two angles. It merges what it finds and removes duplicates:
- Network (outside-in): a port scan that probes exposed services for TLS certificates and cipher suites and protocol versions. No credential needed.
- Deep scan (inside-out): a full crypto-asset scan run from inside the host. It runs either by an installed agent or over SSH or by the network-device scanner for tagged devices.
Scan profiles
| Profile | Coverage | Speed |
|---|---|---|
| Quick | Certificates · keys · packages plus the top 100 ports | Fastest |
| Standard | 25 deep modules plus the top 1,000 ports | Balanced and the recommended default |
| Comprehensive | All 56 deep modules (including Java · .NET · eBPF) plus the top 1,000 ports | Most thorough |
First-time setup
Open the Manage Server in a browser on a fresh install and a three-step wizard launches. You cannot reach any other page until it finishes.
Step 1: create the first administrator
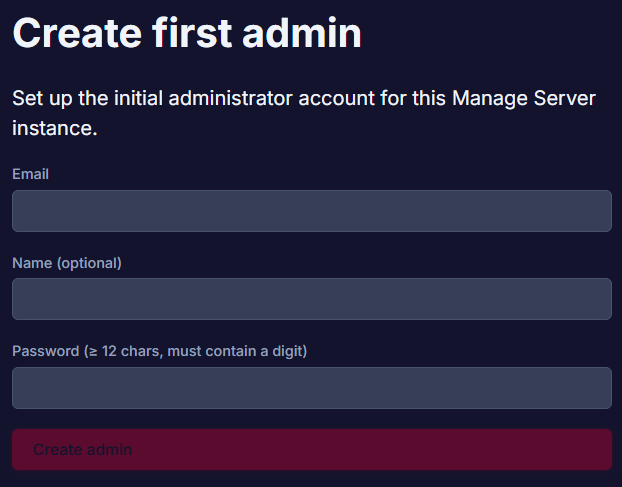
| Field | Notes |
|---|---|
| Becomes your login username. | |
| Name (optional) | Display name shown in the account menu. |
| Password | At least 12 characters and must contain a digit. |
Press Create admin to continue.
Step 2: activate the license
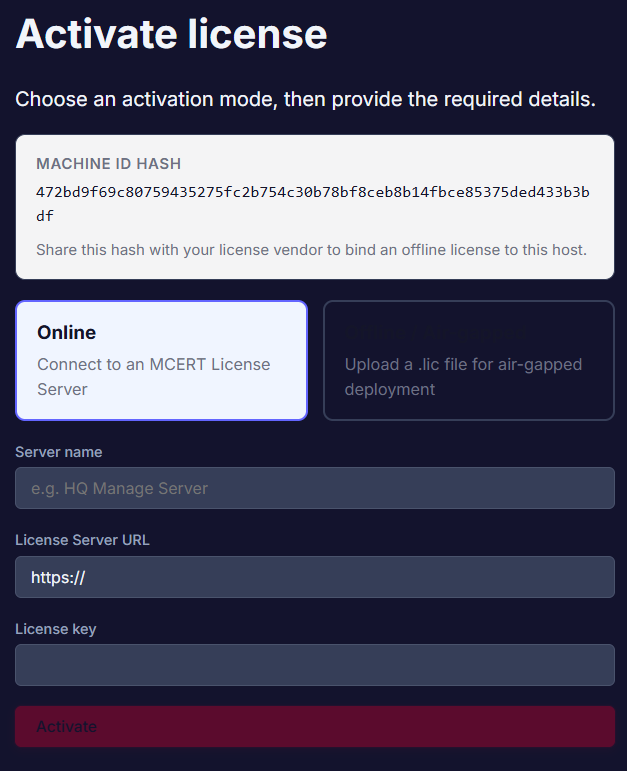
A Machine ID Hash appears at the top. Send this to your vendor if you need an offline air-gapped license bound to this specific machine. Otherwise choose how to activate:
-
Online (default):
fill in the Server name and the License Server URL (for example
https://activation.mcert.tech) and the License key. Then press Activate. - Upload a .lic file: for air-gapped deployments upload the offline license file your vendor gave you.
Step 3: activation complete
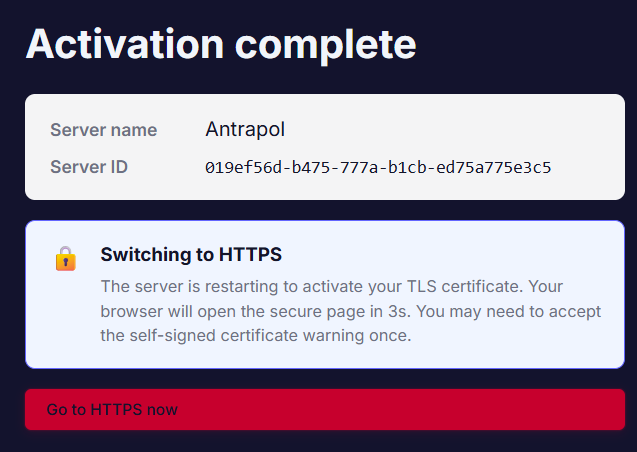
The server confirms its Server name and assigns a Server ID and restarts to switch on HTTPS with a self-signed certificate. Click Go to HTTPS now and accept the browser's certificate warning once.
Why HTTPS is mandatory
Scan jobs are deliberately disabled over plain HTTP: the portal has to run on HTTPS so credentials and scan data stay encrypted in transit. The auto-generated certificate coverslocalhost
and 127.0.0.1. Your browser warns once because the issuing CA is not yet
trusted. It then remembers the exception.
Signing in and the layout
Sign in
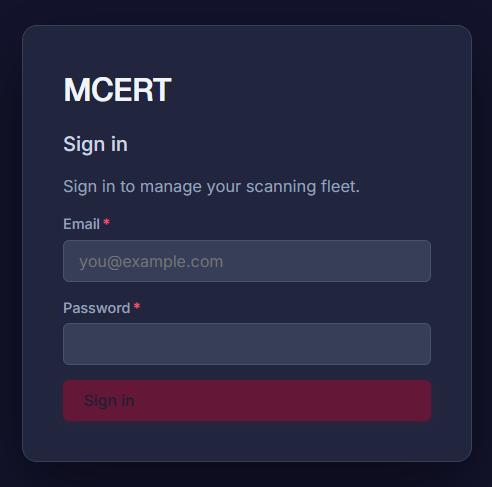
Enter your email and password and press Sign in. Sessions last 24 hours by default. Five failed attempts in a row temporarily locks the account (see Administration).
The persistent layout
The left sidebar carries the MCert logo and a system-health pill (Ready or Checking with a refresh button) and the grouped navigation: Dashboard · Inventory · Planning · Operations · Reports · Admin. Its footer shows the signed-in user and the version and who built it.
The top bar shows a breadcrumb on the left and these controls on the right:
| Control | Action |
|---|---|
| Switch portal | App-switcher to sibling portals (License / Report) when configured. |
| Theme | Cycles Auto (dark) and light and dark appearance. |
| Change password | Opens the change-password screen for your own account. |
| Account menu | Sign out and account actions under your initials. |
Dashboard
Sidebar ▸ Dashboard. The page you land on after signing in that summarises your whole fleet.
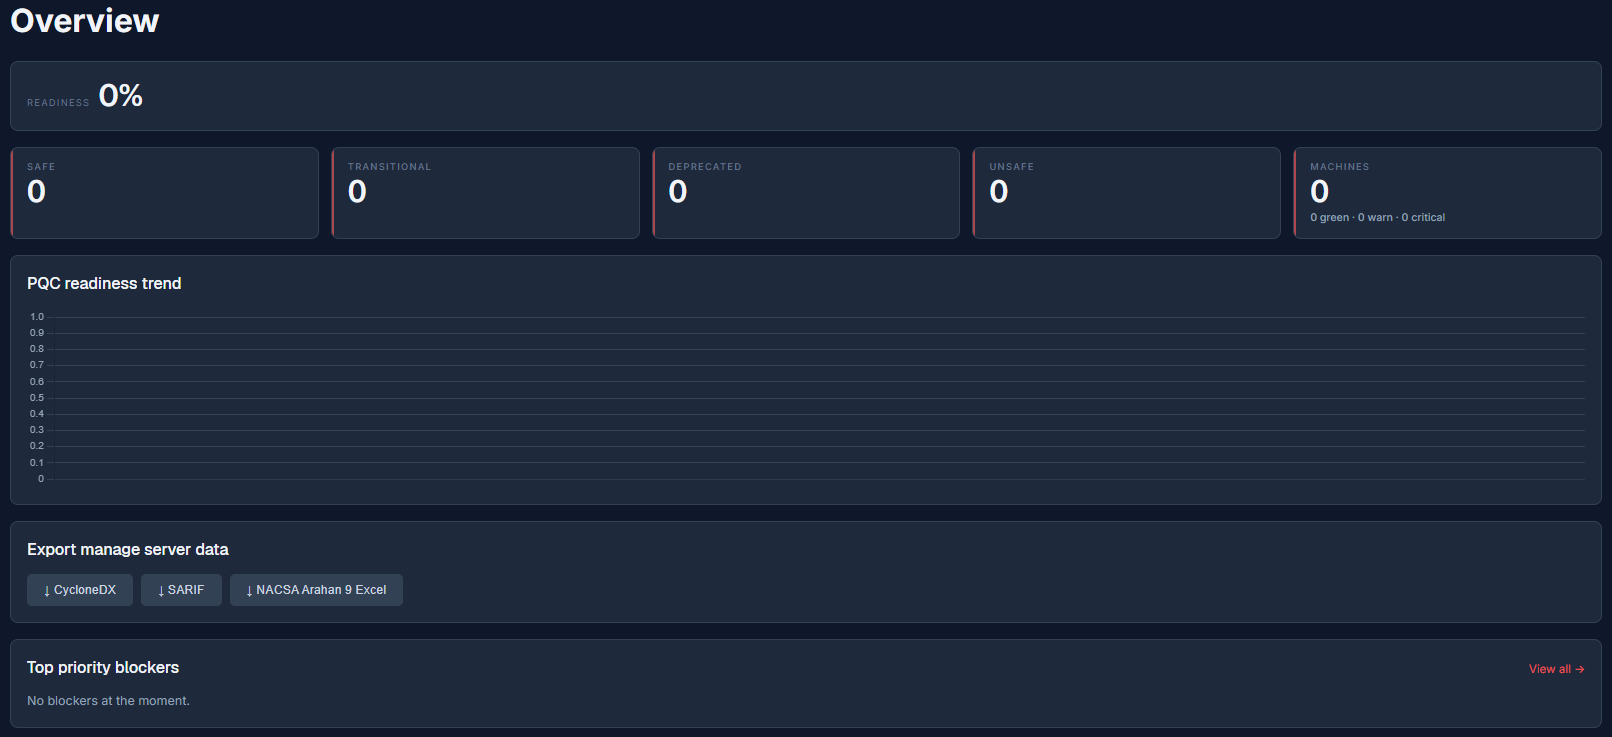
- Readiness is the headline percentage of your inventory that is already SAFE.
- Stat cards break that down into SAFE · TRANSITIONAL · DEPRECATED and UNSAFE counts plus a MACHINES card with a green/warn/critical split.
- PQC readiness trend charts readiness over time.
- Export manage server data gives one-click downloads of everything: CycloneDX · SARIF and the NACSA Arahan 9 Excel workbook.
- Top priority blockers lists your highest-scoring problems; View all opens the Priority report.
Inventory: Tags
Sidebar ▸ Inventory ▸ Tags. Tags are coloured labels you attach to hosts so you can filter and scan them as a group.
Before you scan anything
Everything in Inventory is preparation: the Tags you will filter by and the Hosts and Credentials MCert will connect with and the Applications you will attribute findings to. Set this up once. Every scan and report and NACSA export afterwards needs no further input.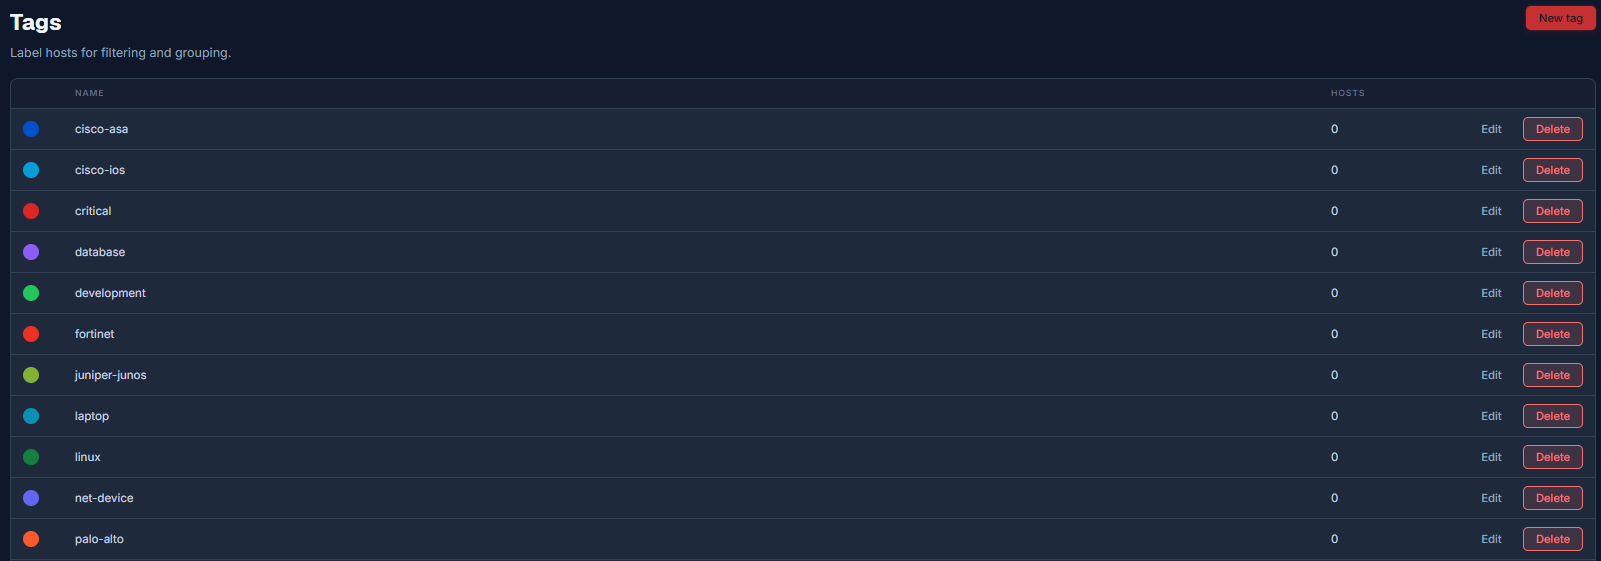
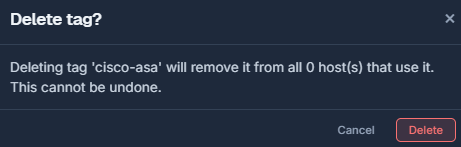
Each row shows a tag's colour dot and name and host count with Edit
and Delete
actions. The pre-seeded set covers linux
· windows
· server
· workstation
· production
· staging
· development
· critical
· database
· web
· net-device
· pqc-scope
and a handful of network-vendor tags such as cisco-asa
and fortinet.
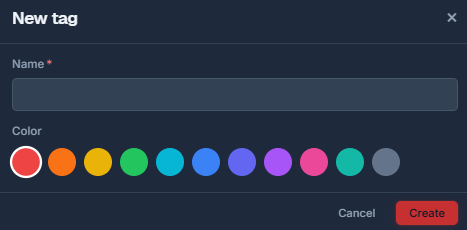
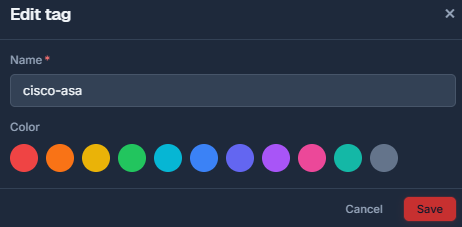
New tag opens an editor: a name (stored lower-case) and a colour from 12 preset swatches. Press Create or Save when editing.
Inventory: Hosts
Sidebar ▸ Inventory ▸ Hosts. The targets available to scan jobs and agent binding are split across two tabs: SSHs (hosts scanned over SSH or the network scanner) and Agents (hosts running an installed agent).

There are four ways to add a host:
This machine
Registers the Manage Server's own host as a scan target in one click.
New host
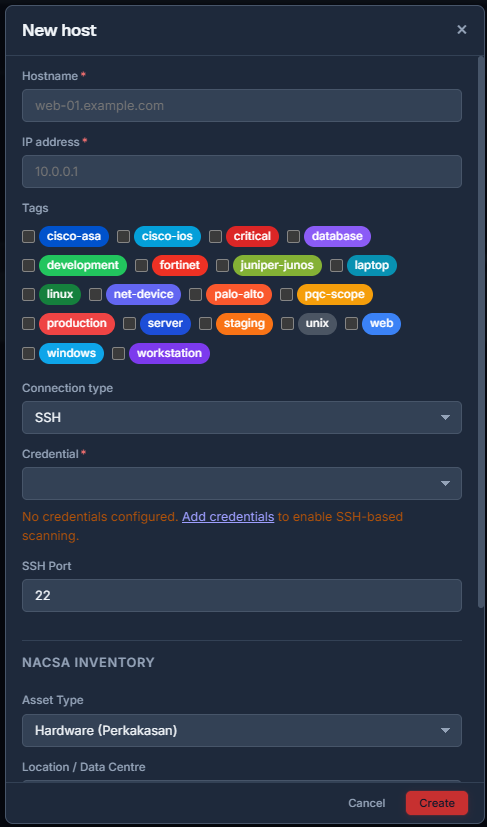
| Field | Notes |
|---|---|
| Hostname (required) | A label such as web-01.example.com. |
| IP address (required) | The address the server connects to. |
| Tags | Tick any tags from the palette. |
| Connection type | SSH · SSH via bastion (jump host) or Agent (managed). |
| Credential (required for SSH) | Pick a saved credential from Credentials below. |
| SSH Port | Default 22. |
| Connection test | Test connection is required before saving. It confirms login and warns if sudo is unavailable. |
| NACSA Inventory | Asset Type · Location · Asset Owner · Legacy System and Notes. These feed the NACSA attribution report. |
Discovery (network scan)
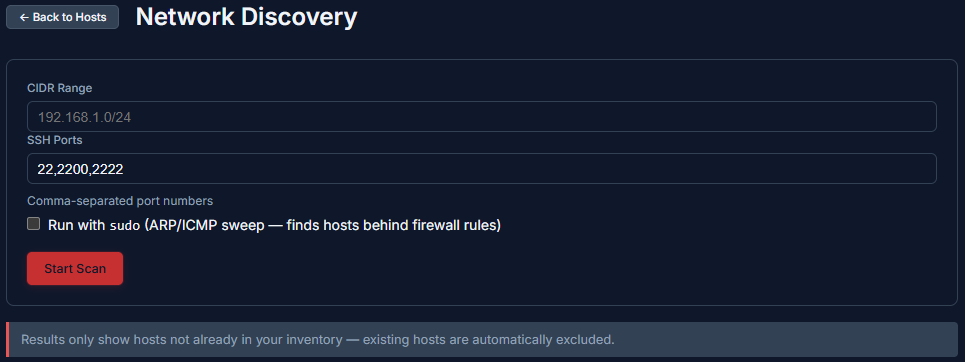
Enter a CIDR range (for example 192.168.1.0/24) and SSH ports to probe (default 22,2200,2222) and optionally run with sudo for an ARP/ICMP sweep that also
finds hosts hidden behind firewall rules. Press Start Scan. Results list
only hosts not already in inventory. Tick the ones you want and adjust each hostname if
needed. Then Import Selected.
Bulk import
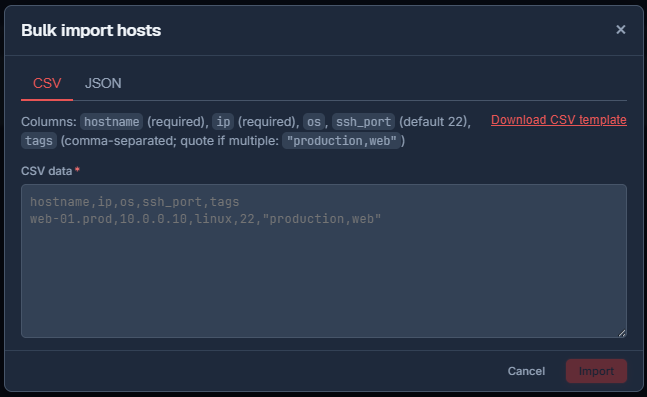
The CSV tab accepts columns hostname
(required) and ip
(required) and os
and ssh_port
(default 22) and tags
(comma-separated and quoted when there is more than one). A Download CSV template link and a
live preview validate every row as you go.
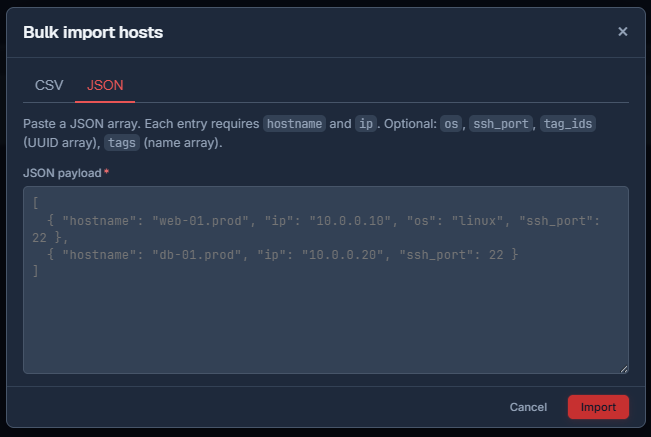
The JSON tab takes an array of host objects. Each needs hostname
and ip
with optional os
and ssh_port
and either tags
(names) or tag_ids
(UUIDs).
Agents: remote scan workers
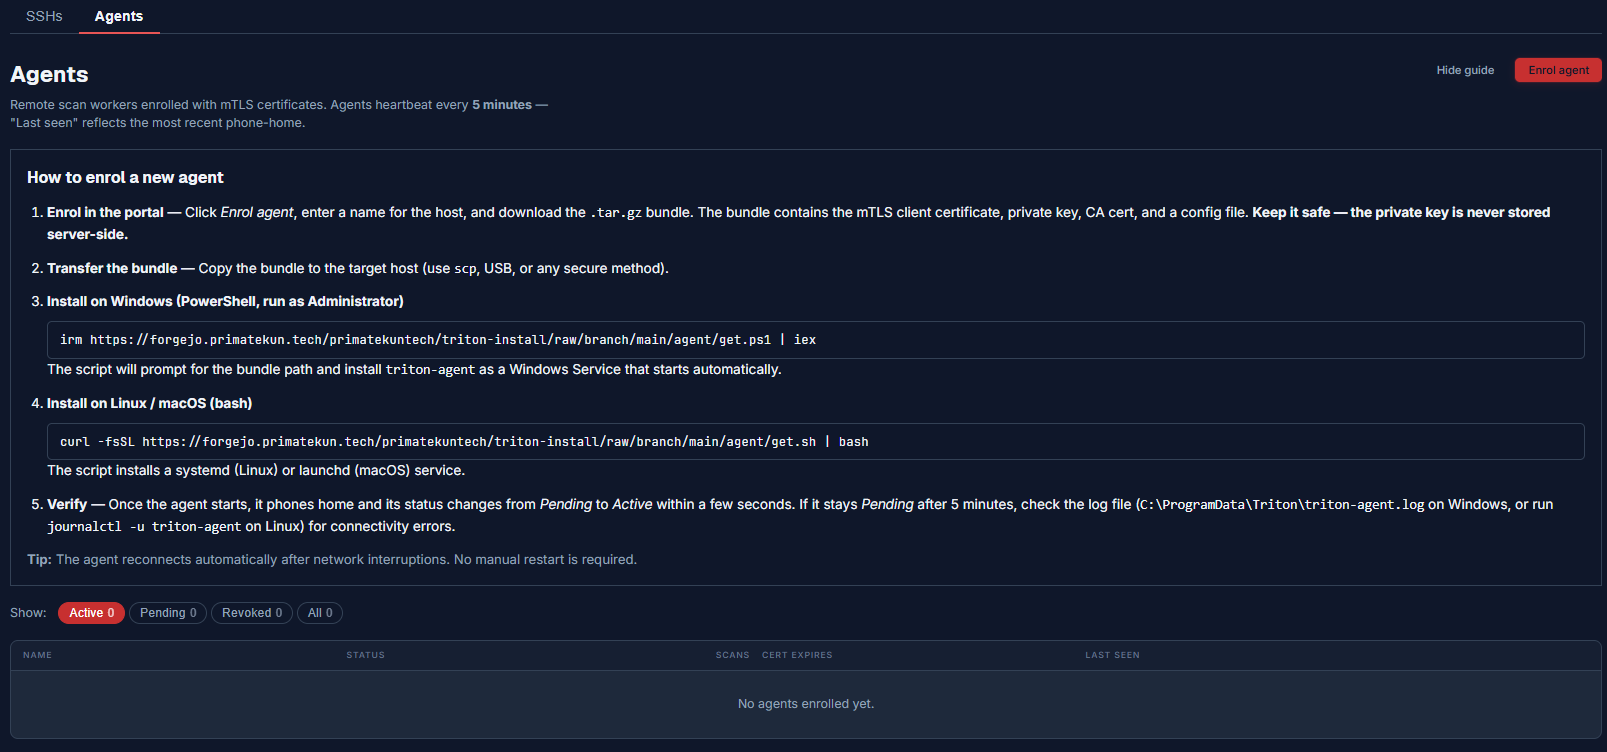
Agents heartbeat every 5 minutes. Last seen reflects the most recent one. They work best where SSH is not allowed or where you want continuous scheduled self-scanning.
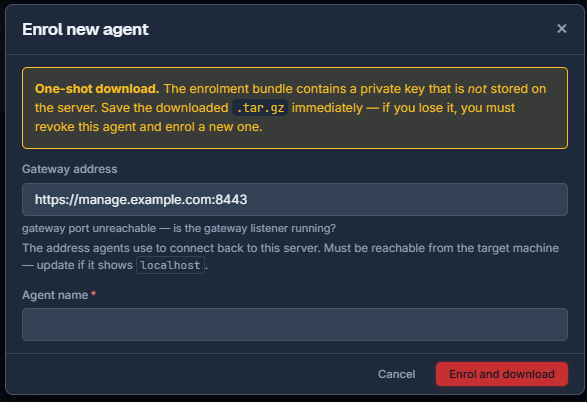
| Field | Notes |
|---|---|
| Gateway address | Auto-detected URL the agent calls home to such as https://192.168.1.100:8443. A live check confirms the port is reachable. Edit it if it shows localhost. It must be reachable from the target and not from your browser. |
| Agent name (required) | A label for this agent. |
Save the enrolment bundle immediately
Enrolment is one-shot: the downloaded.tar.gz
bundle contains a private key that is never stored on the server. If you lose it revoke the
agent and enrol a new one.
After you press Enrol and download an installation guide gives a copy-paste one-line installer per platform. On Linux for example:
curl -fsSL https://forgejo.primatekun.tech/primatekuntech/triton-install/raw/branch/main/agent/get.sh \
  | sudo bash -s -- --bundle ./<bundle>.tar.gz
The installer sets up the triton-agent
daemon and the triton
scanner. It registers a service (systemd or launchd or Windows Service) and authenticates
with mutual TLS. On Linux confirm it with systemctl status triton-agent. The
agent then appears in the Agents table and starts on every reboot.
Inventory: Credentials
Sidebar ▸ Inventory ▸ Credentials. SSH keys and passwords encrypted at rest with AES-256-GCM in a server-side vault.

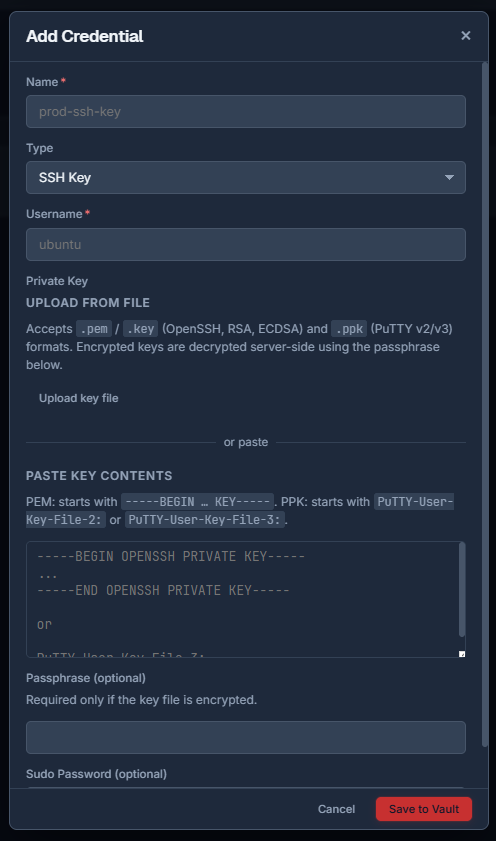
| Field | Notes |
|---|---|
| Name (required) | For example prod-ssh-key. |
| Type | SSH Key · SSH Password or WinRM Password (Windows). |
| Username (required) | The login user such as ubuntu or upm or Administrator. |
| Private Key (SSH Key) | Upload a .pem or .key or .ppk file or paste the contents (PEM or PuTTY PPK v2/v3). |
| Passphrase (optional) | Only needed if the key itself is encrypted. |
| Password (password types) | The account password. WinRM adds a "Use HTTPS (port 5986)" toggle. |
| Sudo Password (optional SSH) | Enables root-level deep scans. Leave it blank if you do not need one. |
Press Save to Vault. Editing a credential lets you rotate the username and private key via Update Vault Secret.
Inventory: Applications
Sidebar ▸ Inventory ▸ Applications. Applications attribute crypto findings to a named business system for the NACSA Arahan 9 attribution report.

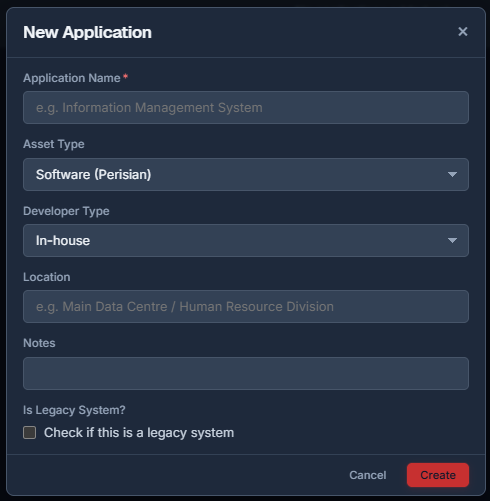
| Field | Notes |
|---|---|
| Application Name (required) | For example Information Management System (HRMIS). |
| Asset Type | Software (Perisian) or Hardware (Perkakasan). |
| Source | In-house · Vendor or Open Source. |
| Location / Owner | For example Main Data Centre / ICT Division. |
| Notes | Free text. |
| Is Legacy System? | Tick if it is so the report flags it. |
Press Create. The Components button on each row opens a modal where you map the application's individual software components. That feeds the SBOM and attribution views.
Planning: Phases
Planning is where a scan's findings become a costed and dated migration programme. Phases records when each NACSA stage happens; Budget (next) records what it costs. Both flow straight into the NACSA Arahan 9 export. An assessor then sees your timeline and your ringgit figures alongside your findings.
Sidebar ▸ Planning ▸ Phases. The five standard NACSA migration phases (Fasa). Each has its own colour and an Edit action for dates and activities.
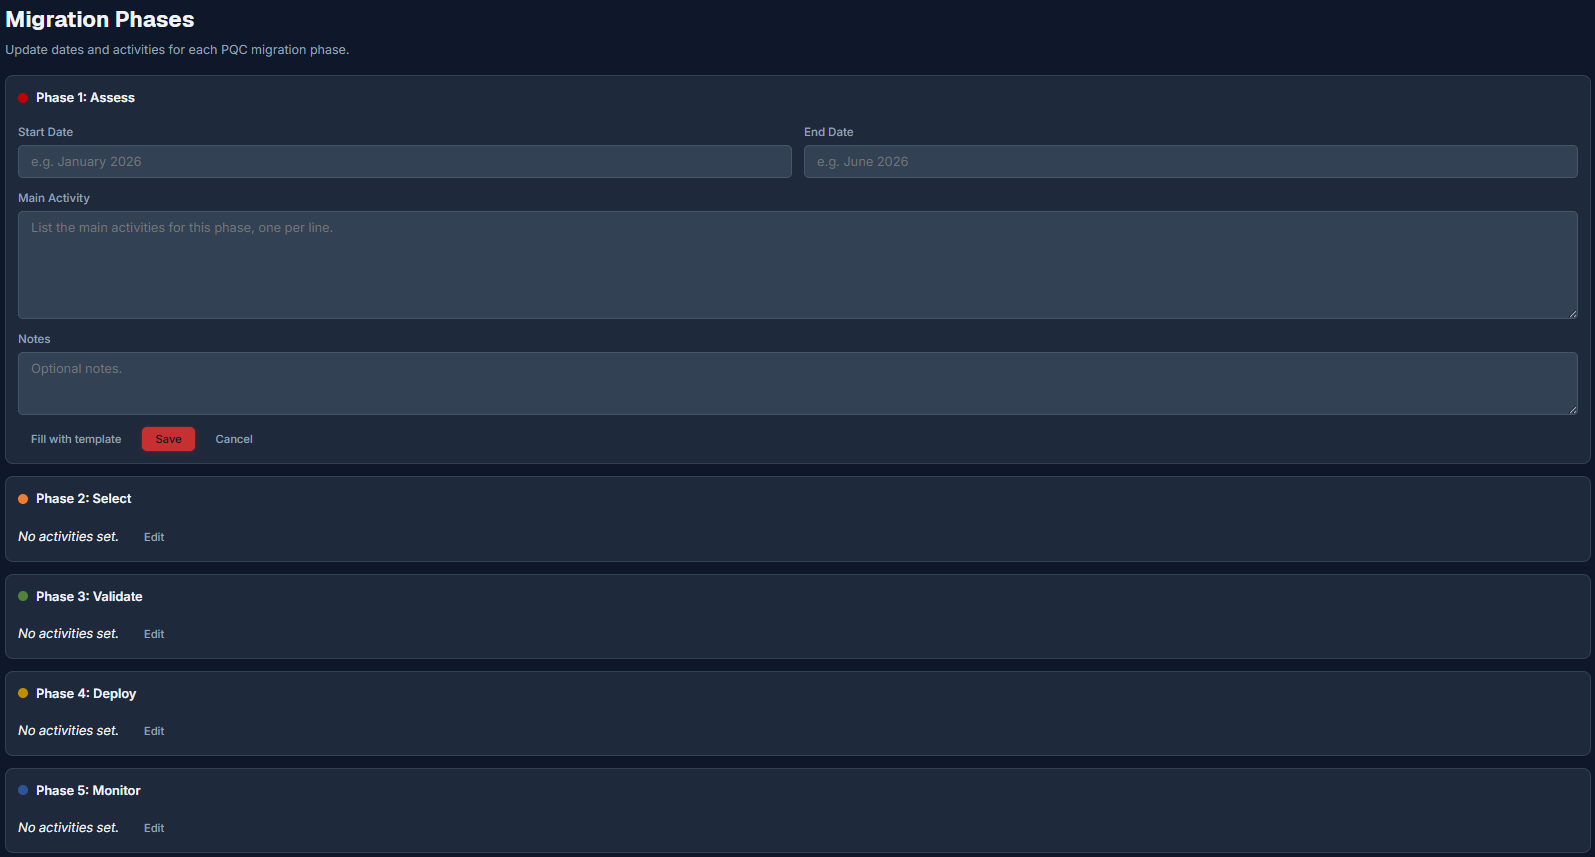
Each phase's edit form has a Start Date · End Date · Main Activity (one line per activity) · Notes and a Fill with template button that drops in NACSA's standard activity list for that phase. Progress against these phases shows up on the NACSA report's Migration tab.
Use the template
Fill with template pre-fills the official NACSA activities for each phase (Assess for example pre-fills inventory · crypto-dependency identification · Harvest-Now-Decrypt-Later classification · risk assessment and crypto-agility evaluation). Adjust the dates to your own programme afterwards.Planning: Budget
Sidebar ▸ Planning ▸ Budget. The resource budget behind the NACSA Arahan 9 export.
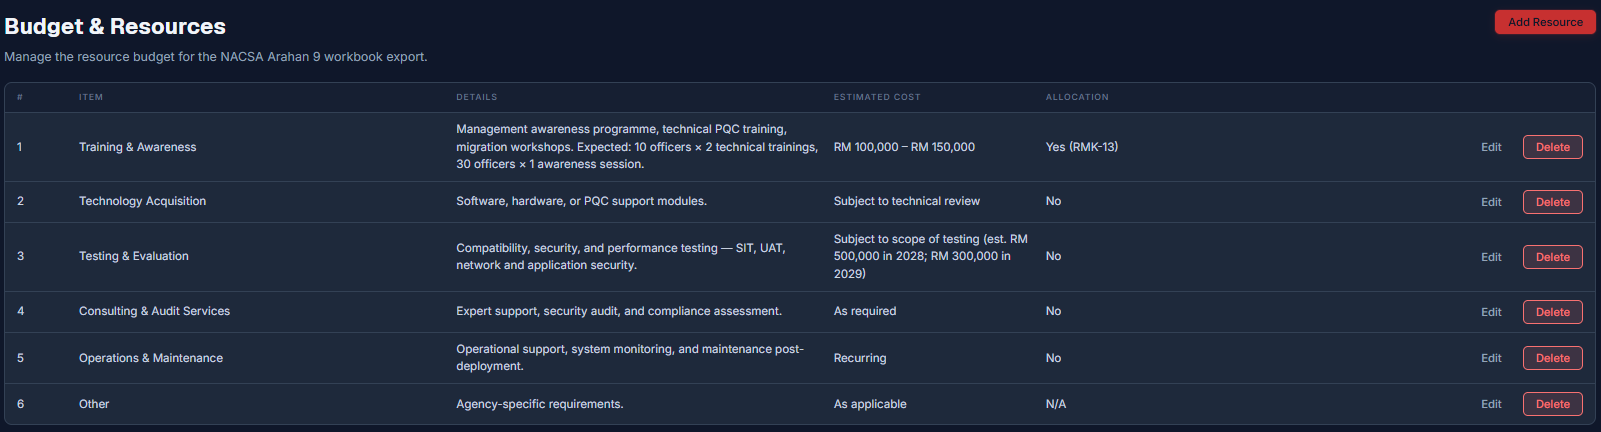
The table is a costed resource list: item number · item · details · estimated cost and allocation with Edit and Delete per row. It ships pre-seeded with Training & Awareness · Technology Acquisition · Testing & Evaluation · Consulting & Audit Services · Operations & Maintenance and Other.
How to fill in real numbers
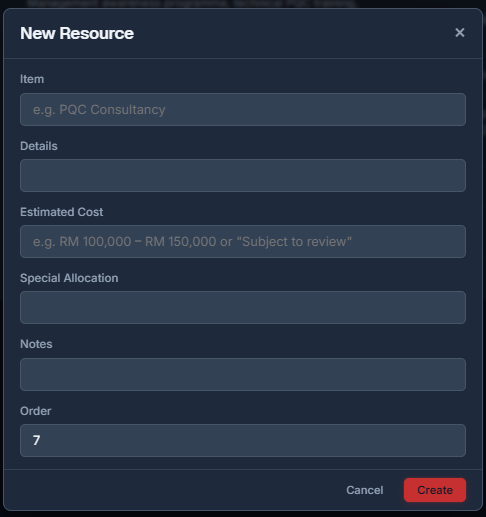
Start from the six pre-seeded lines and replace the placeholders. Training & Awareness is headcount times sessions times cost per session (30 officers across 2 technical trainings might land around RM100,000 to RM150,000). For Technology Acquisition and Testing & Evaluation use vendor or lab quotes or mark them "Subject to technical review" until one arrives. Consulting & Audit Services and Operations & Maintenance are recurring. Budget them per year and not once. Use Special Allocation to flag a line already funded under a government programme (for example RMK-13). Use Order to control how items appear in the exported workbook.Operations: Scan Jobs
Sidebar ▸ Operations ▸ Scan Jobs. The scan queue across agents and tags polls every 5 seconds. This is the operation itself: each scan job runs the Network and/or Deep lens against the hosts and credentials you set up in Inventory. Its results populate every report below.
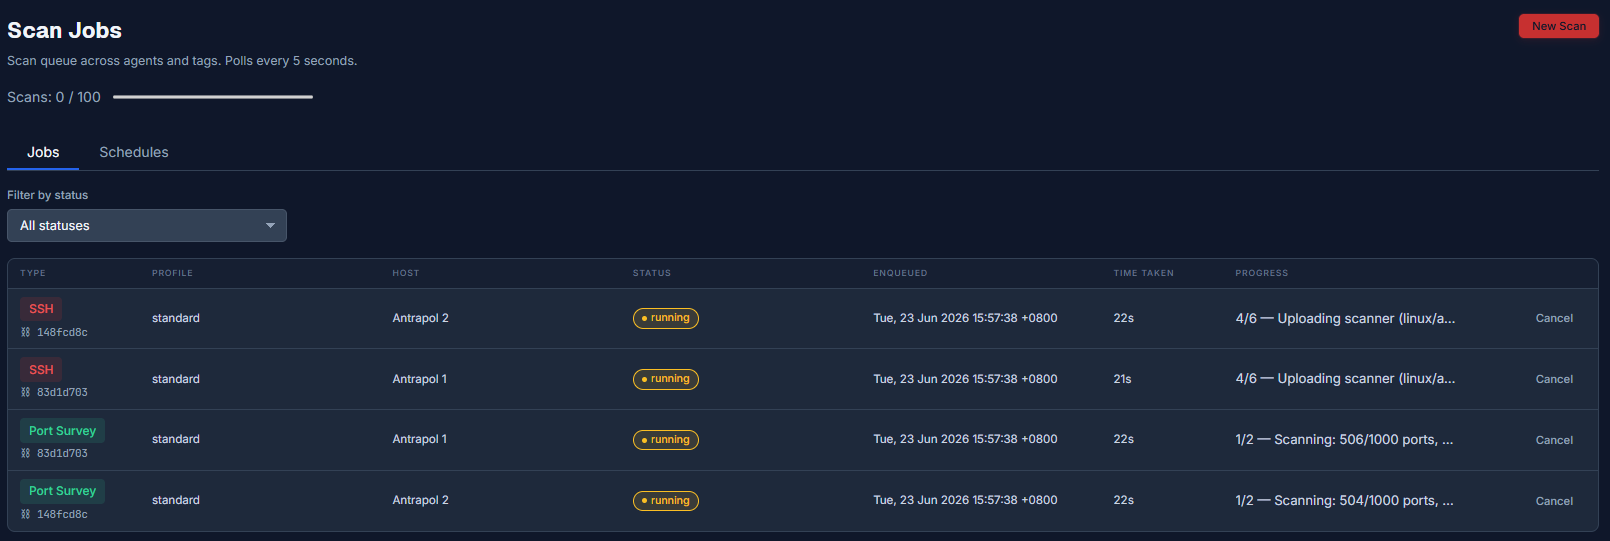
Two tabs. Jobs is the live queue. It has a scans-used license meter and a status filter and columns for type · profile · host · status · enqueued time · time taken and progress with a Cancel action on running or queued jobs. Type is either Port Survey (the network lens) or SSH / agent (the deep lens). Status moves from queued to running to completed or failed or cancelled. Progress shows live stage text such as "4/6, Uploading scanner".

Creating a scan: the New Scan wizard
New Scan opens a six-step wizard. The left rail tracks your progress through it.
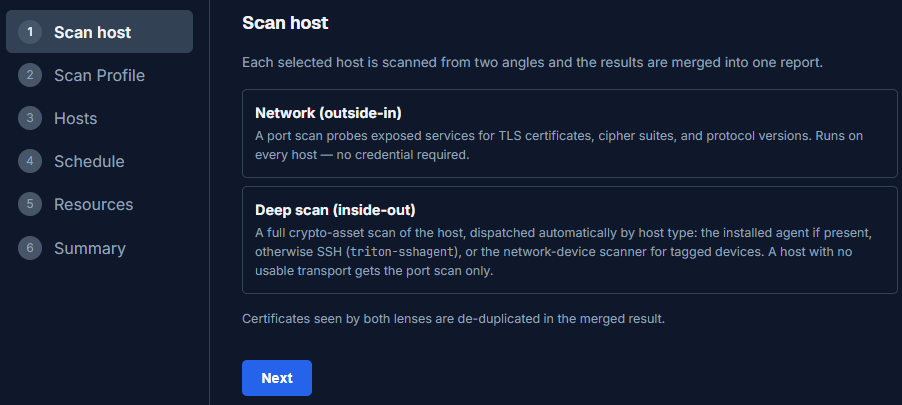
Step 1: Scan host. Explains the Network (outside-in) and Deep (inside-out) lenses that always run and merge. Press Next.
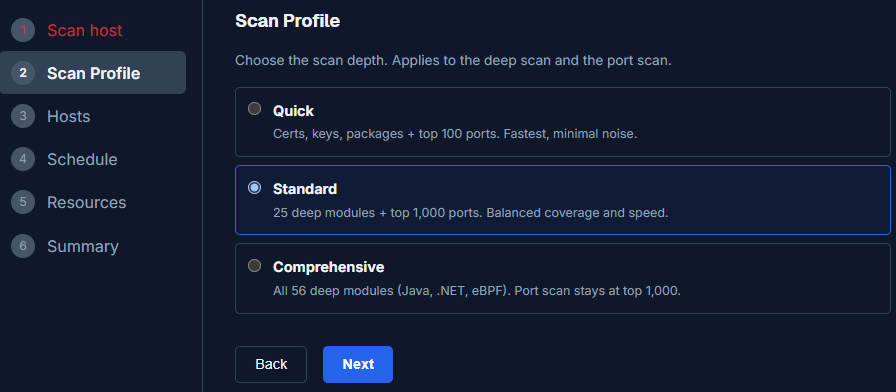
Step 2: Scan Profile. Choose Quick · Standard or Comprehensive. Standard is the default.
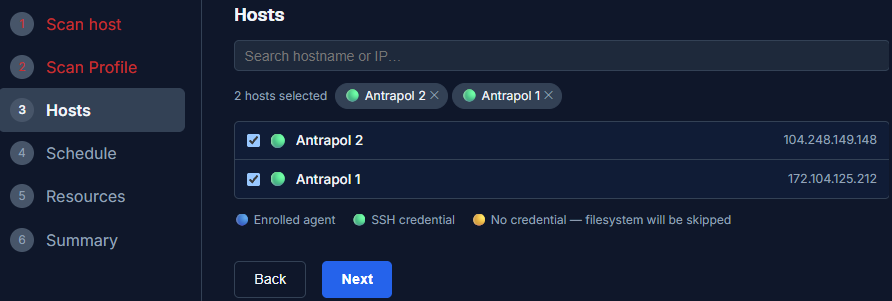
Step 3: Hosts. Tick the host or hosts to scan. A legend shows each host's readiness: blue means an enrolled agent · green means an SSH credential is on file · amber means no credential (the filesystem pass gets skipped). A search box filters by hostname or IP.
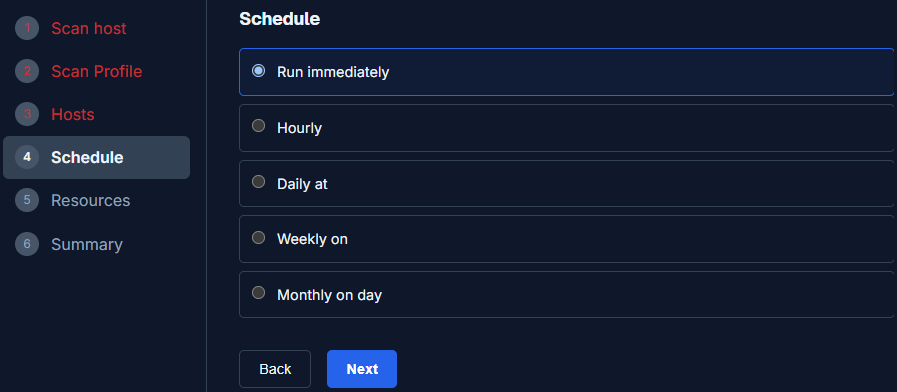
Step 4: Schedule. Run immediately (the default) · Hourly · Daily at a set time · Weekly on a chosen day or Monthly on a chosen day. Anything other than immediately creates an entry on the Schedules tab.
Step 5: Resource Limits. Optional caps enforced in-process on the target with no root needed: a CPU limit that throttles · a memory limit that a watchdog kills at 1.5 times the cap and a max duration that cancels the scan when the wall clock runs out. Leave these Unlimited unless you are scanning a sensitive production box.
Step 6: Summary. Review your choices. The wizard creates one Port Survey job plus one deep job per host. Press Enqueue N jobs.
Scan job detail
Click any job row to open its detail page: status · the exact command that ran · host · profile · worker · timestamps and a live activity log walking through the six SSH stages: connecting · detecting platform · fetching the scanner binary · uploading it · scanning remotely and submitting results. Failed jobs show the full error here (see Troubleshooting).
The report pages let you drill from a summary down to the individual finding. Most can be exported. Everything from here on is built from completed scan jobs. This is where raw findings become the CBOM · SBOM · priority list and NACSA Arahan 9 workbook you actually hand to auditors or management or NACSA.
Reports: Scans
Sidebar ▸ Reports ▸ Scans. Every scan across your fleet as a history table: date · host · findings and a breakdown by status.

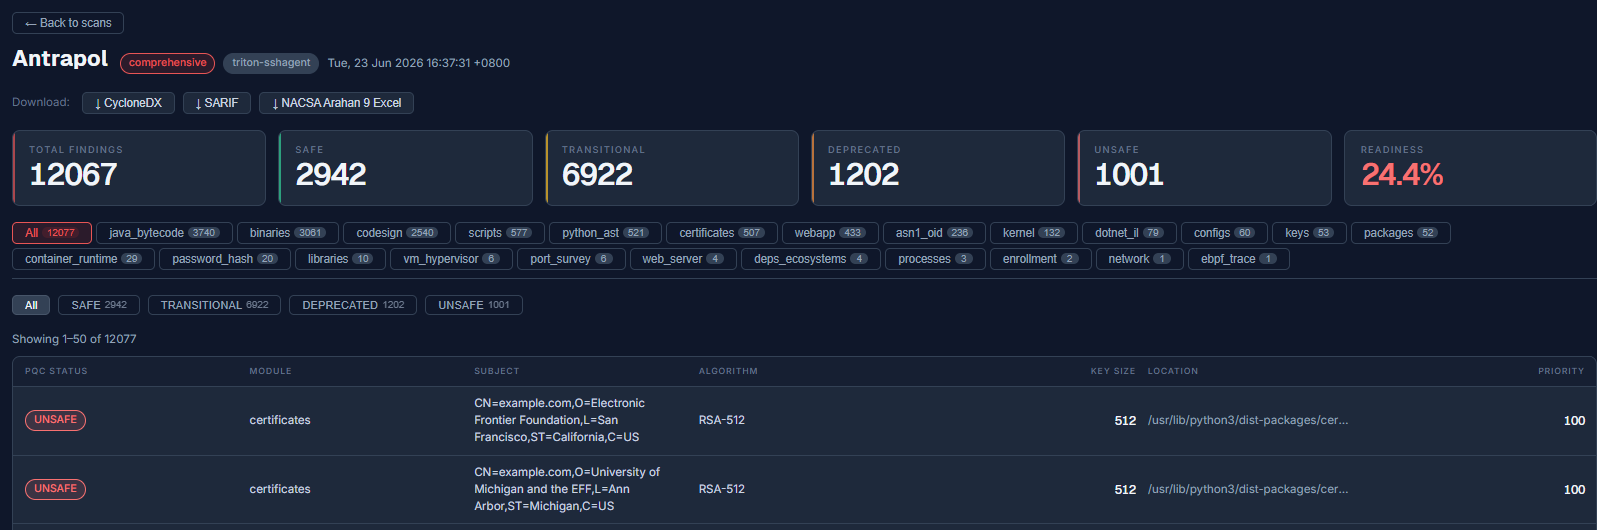
Click a row for the scan detail: host · profile · scan source · download buttons for
CycloneDX · SARIF and NACSA Excel · headline stat cards and two filter rows. One filters by
module (binaries · python_ast · scripts · webapp · certificates · packages · configs · keys
· libraries and more) and one filters by PQC status. The findings table lists PQC status
· module · subject · algorithm · key size · location and priority. For example: UNSAFE
· binaries · MD5 · /usr/bin/curl · priority 100.
Reports: Hosts
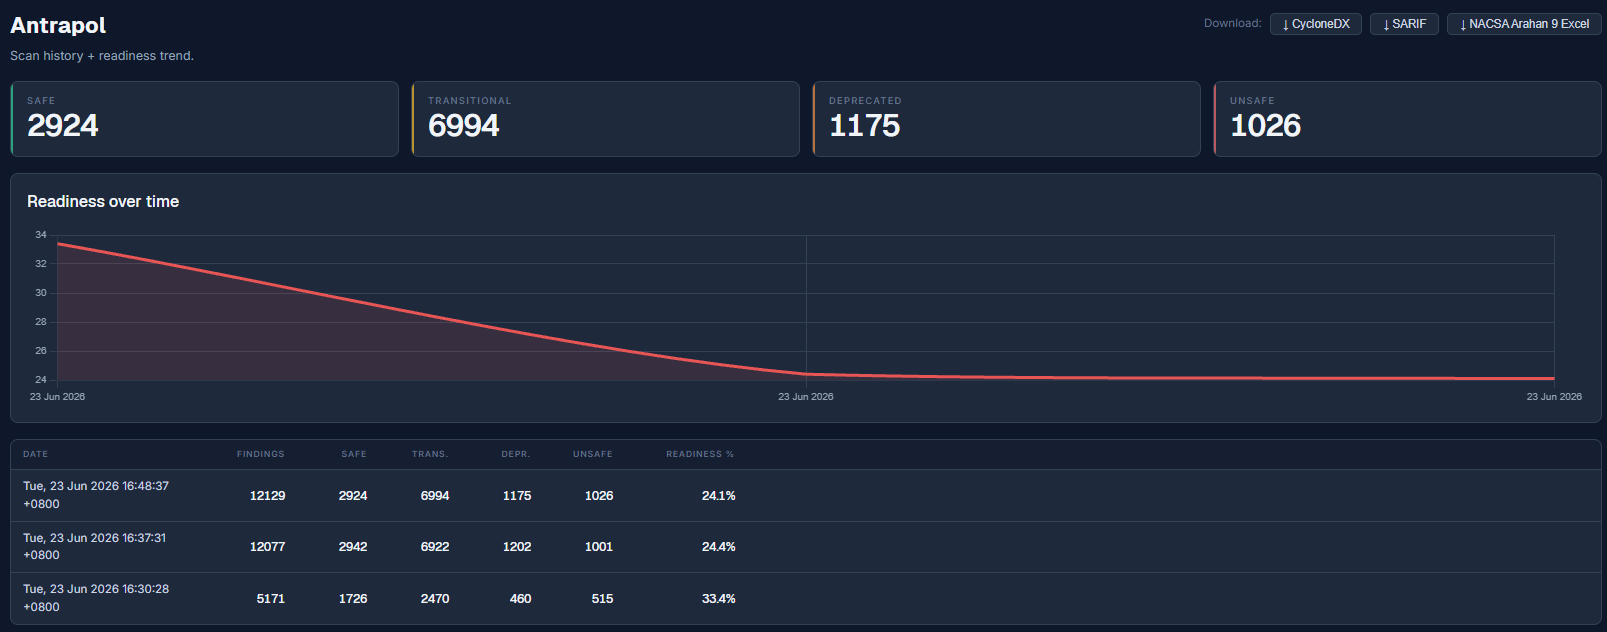
Sidebar ▸ Reports ▸ Hosts. Every machine ranked by readiness worst first.

Reports: Inventory
Sidebar ▸ Reports ▸ Inventory. Every crypto asset across your fleet grouped by algorithm and key size.
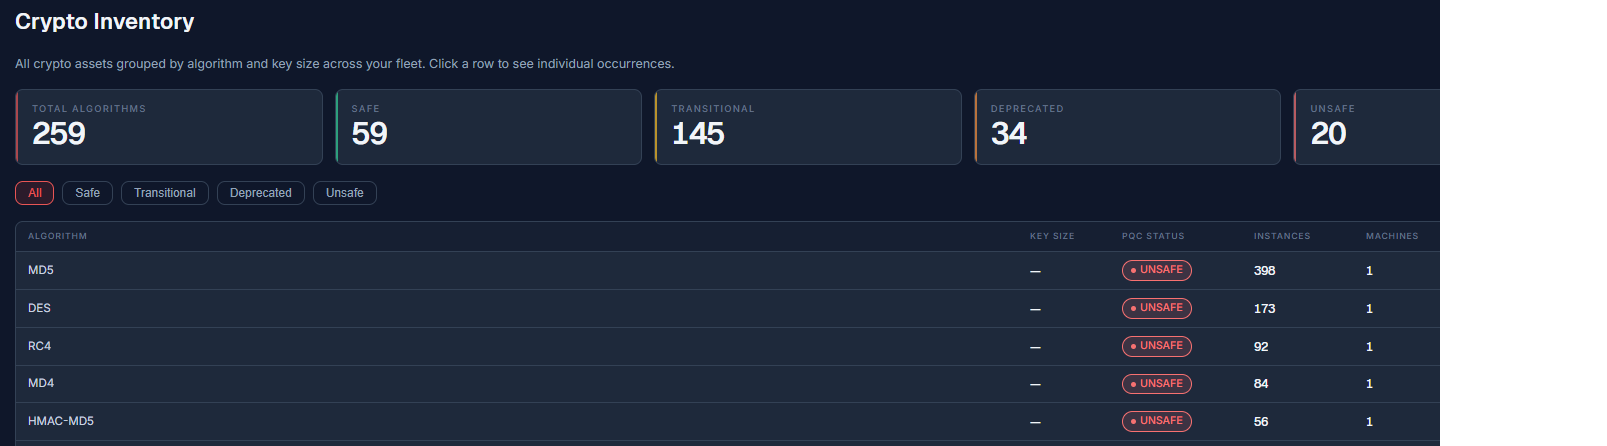
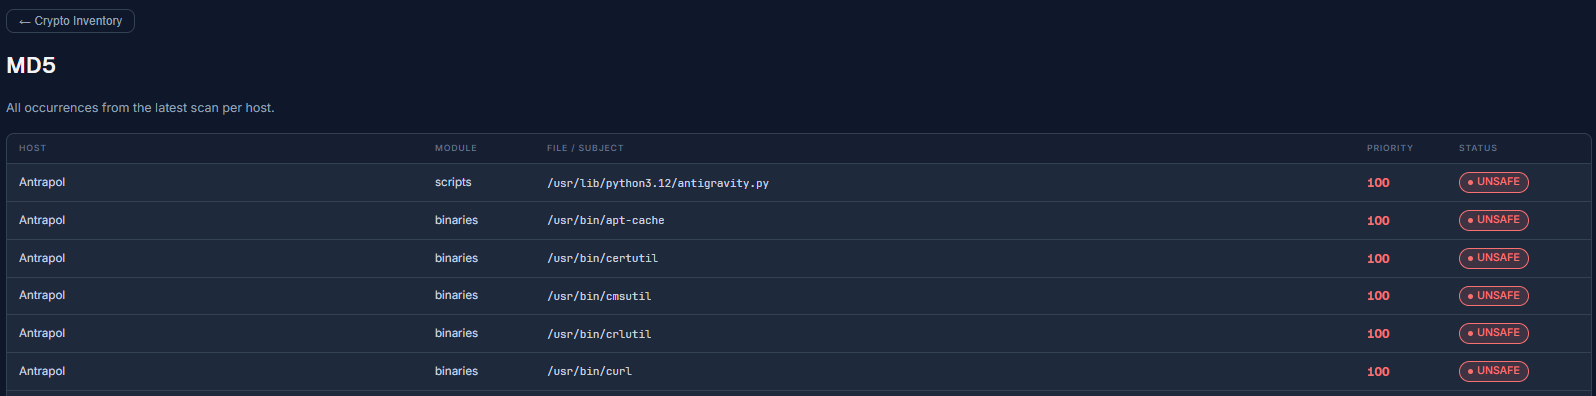
The table lists algorithm · key size · PQC status · instance count · machine count and max priority. For example: MD5 · UNSAFE · 166 instances · 1 machine · priority 100. Click any algorithm to see every occurrence:
Reports: Certificates
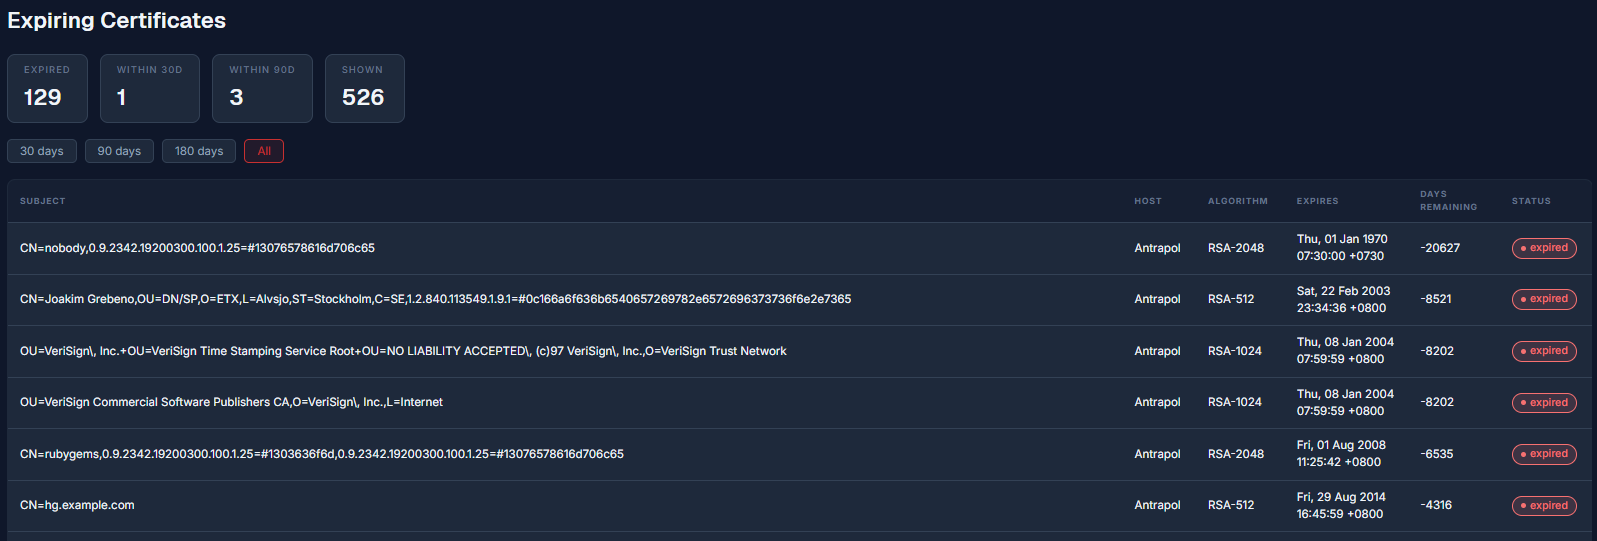
Sidebar ▸ Reports ▸ Certificates. Expiring certificates: cards for Expired · Within 30 days · Within 90 days and Shown with range chips for 30 · 90 · 180 days or All.
Reports: Priority
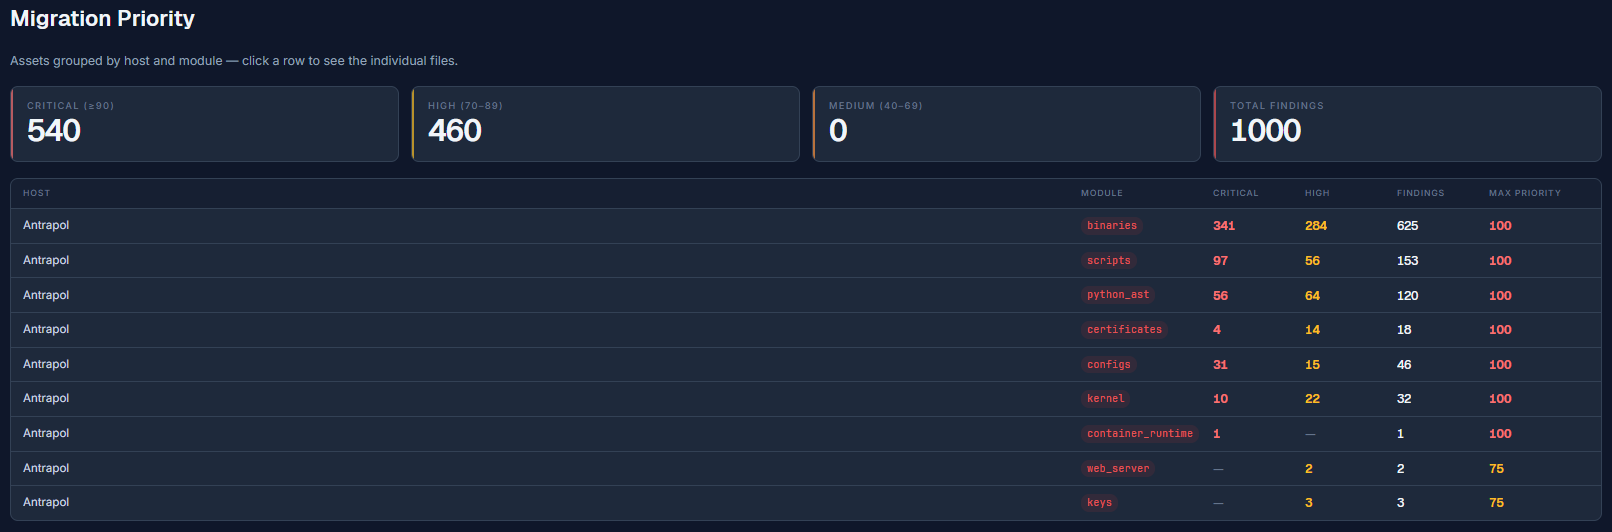
Sidebar ▸ Reports ▸ Priority. Assets grouped by host and module so you can attack the biggest problem areas first. Cards show Critical (90 and above) · High (70 to 89) · Medium (40 to 69) and total findings.
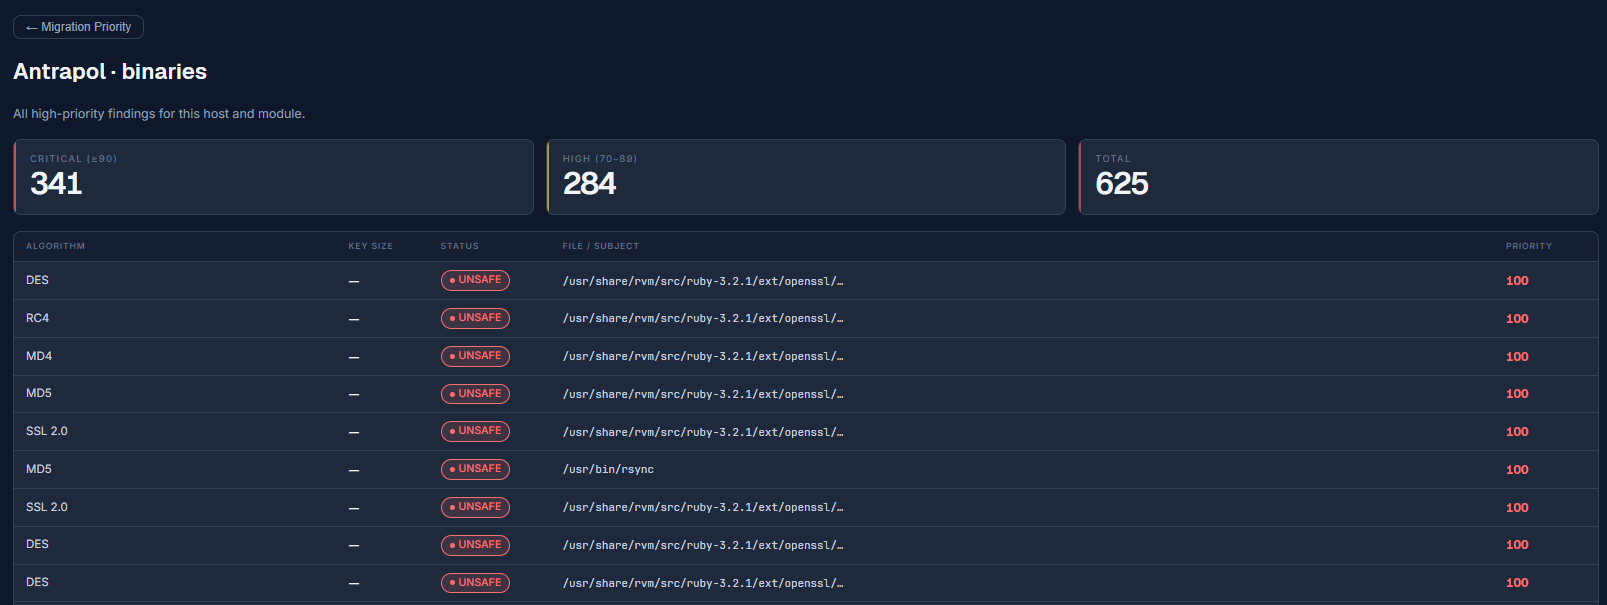
Click a row to list the individual files or assets behind it:
Reports: NACSA Arahan 9
Sidebar ▸ Reports ▸ NACSA Arahan 9. The flagship compliance report. The ↓ NACSA Arahan 9 Excel button exports the full government workbook. An "All Servers" selector focuses the per-host views. Seven tabs:
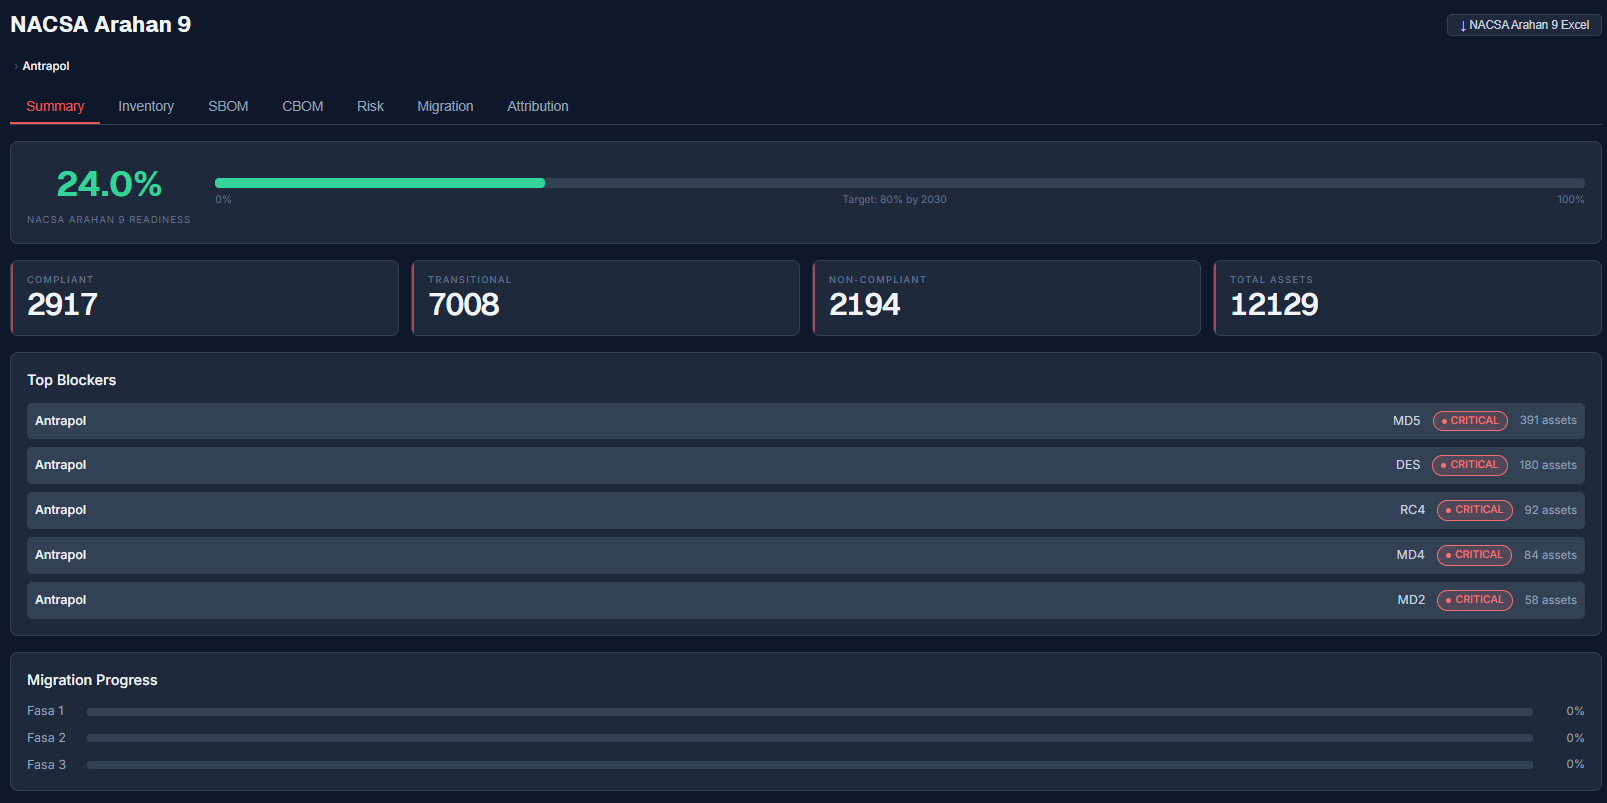
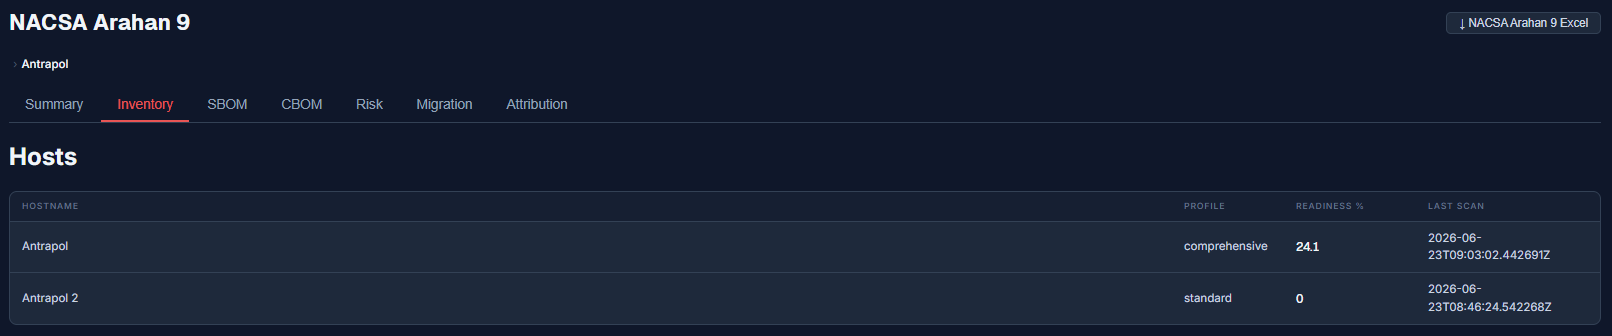
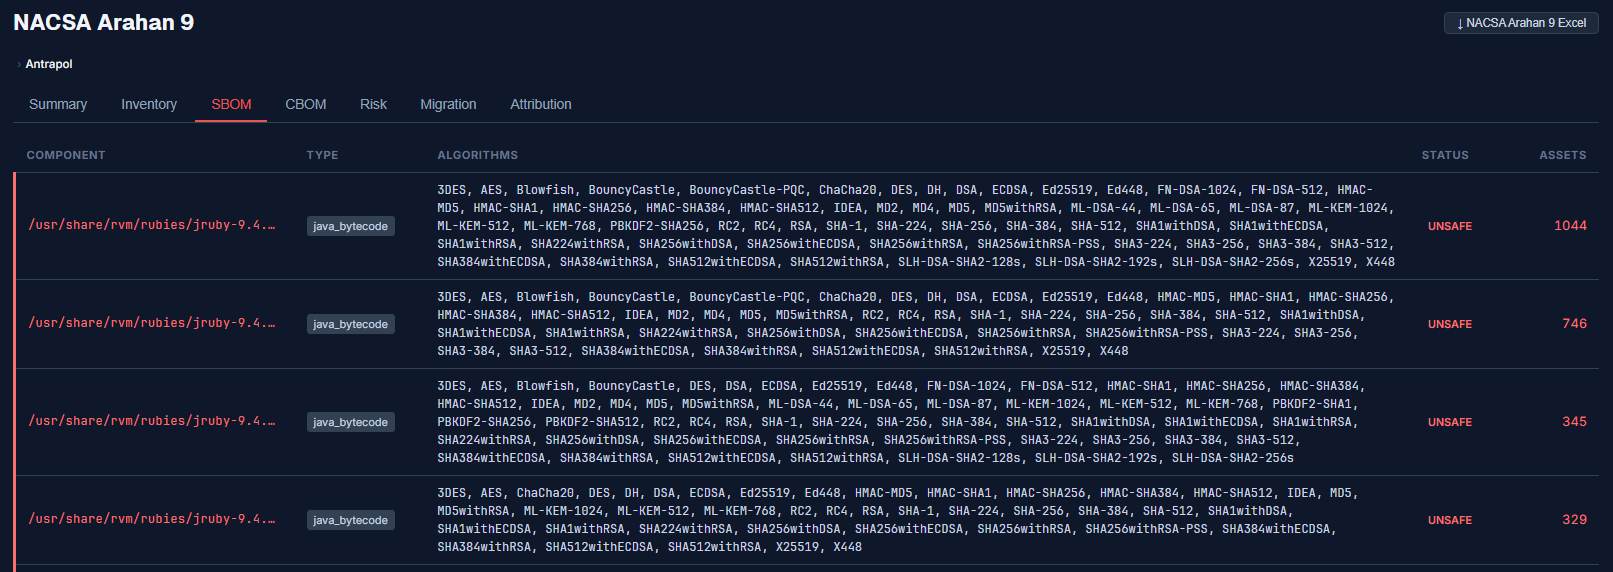
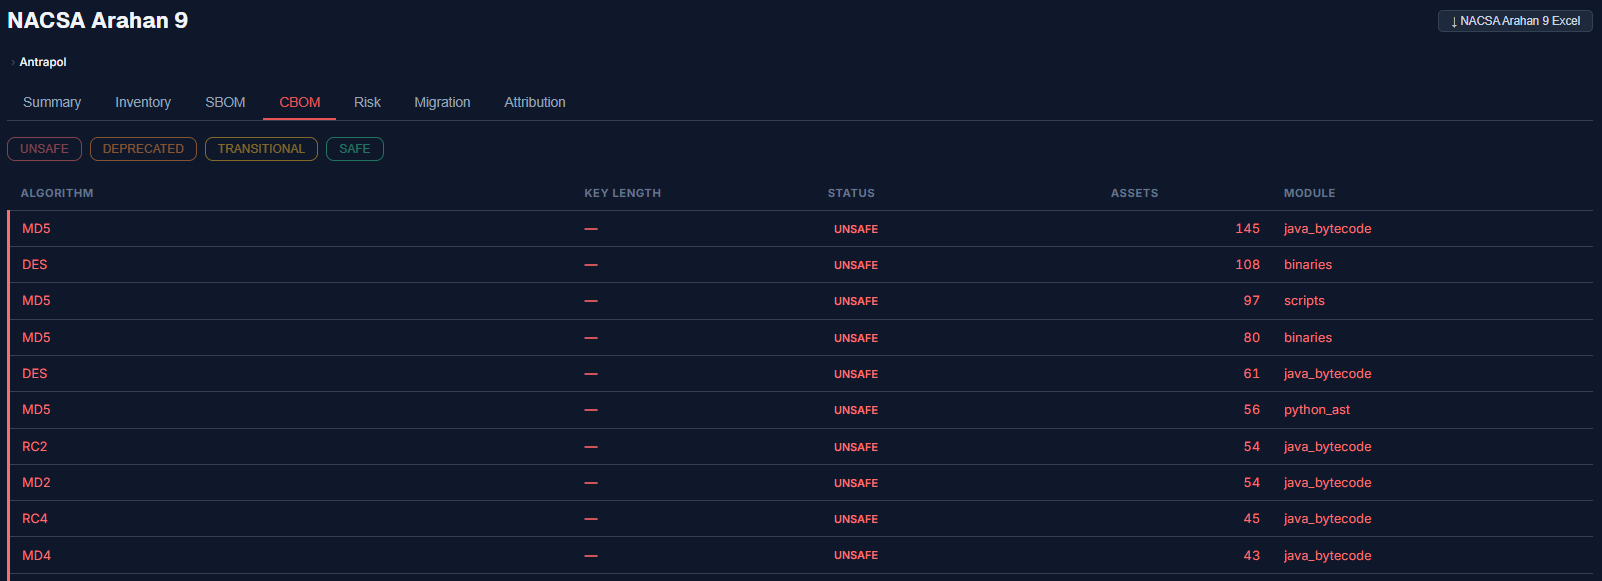
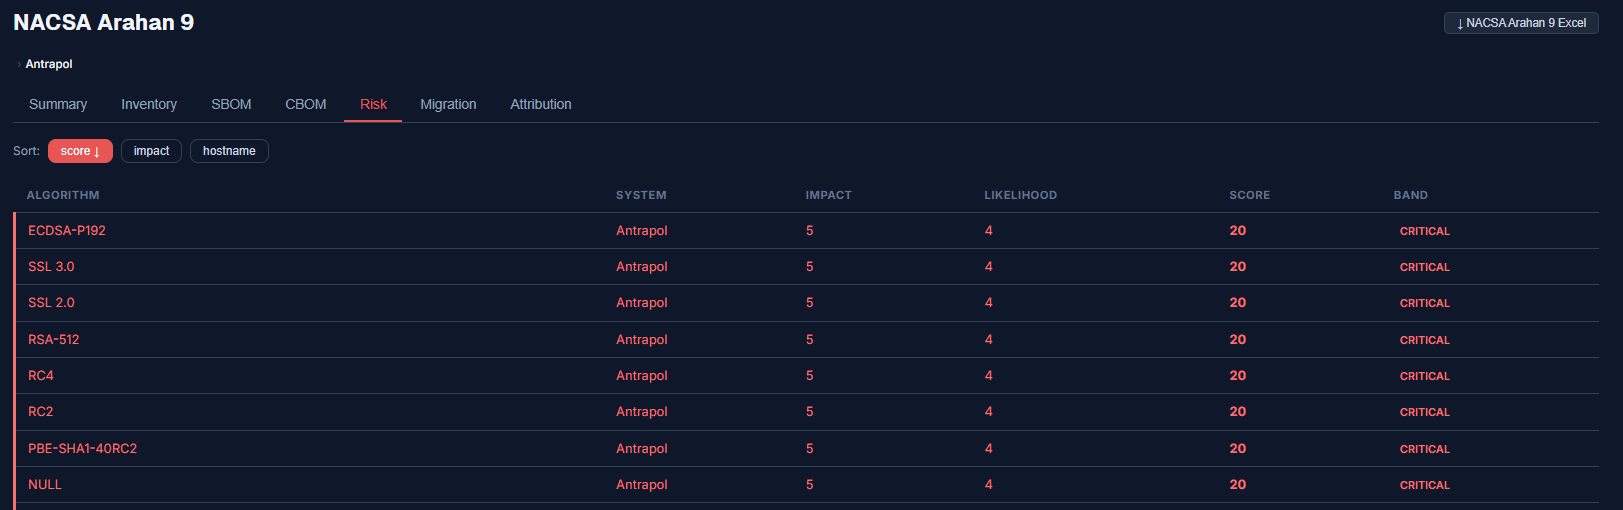
The remaining two tabs are Migration and Attribution. Migration tracks progress against the five phases from Planning. Attribution maps findings to the Applications you registered and their owners.
Reports: PQC Config
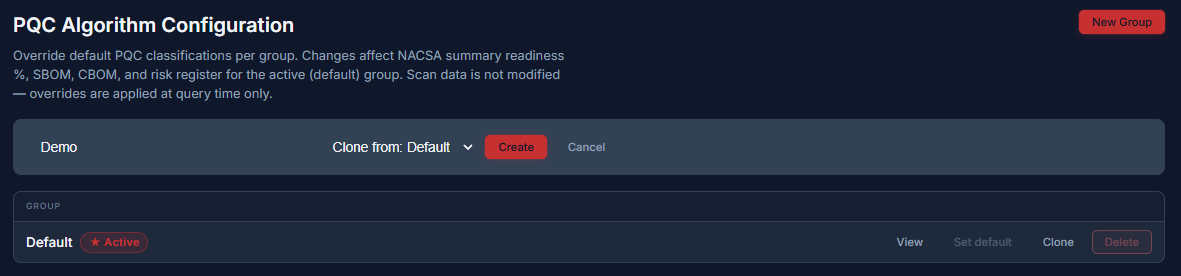
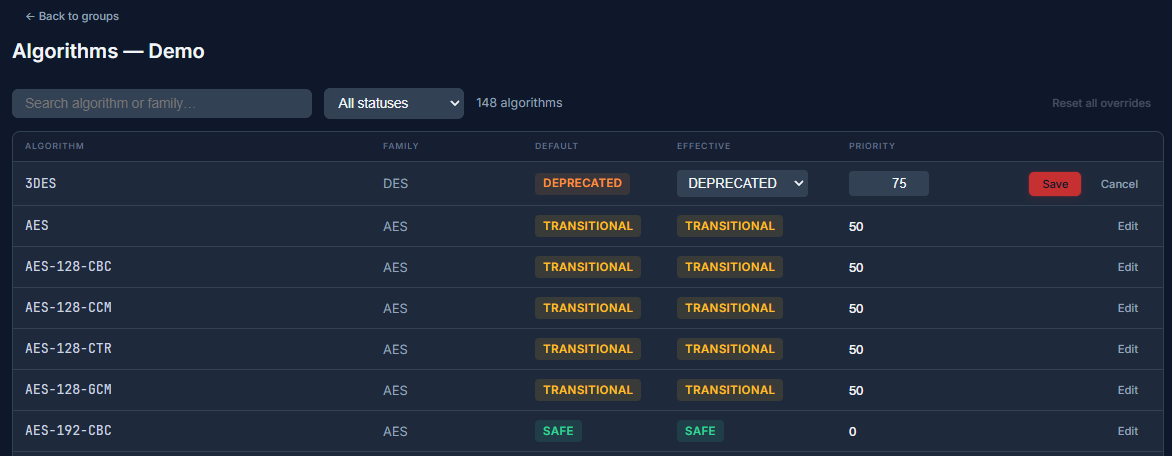
Sidebar ▸ Reports ▸ PQC Config. Override how algorithms are classified per group. Changes affect the NACSA summary readiness percentage · SBOM · CBOM and risk register for the active group. Scan data itself is never modified: overrides apply at query time only.
Administration: Users and Security
Users
Sidebar ▸ Admin ▸ Users. Manage portal operators. Temporary passwords are shown once at creation.

| Role | Can access |
|---|---|
| admin | Everything. |
| network_engineer | Inventory · Operations and Reports. |
| report_reader | Dashboard and Reports only. No Inventory · Operations or Admin. |
New user takes an email and name and role. On creation a temporary password is shown once: copy it for the user since they must change it at first login.
Security
Sidebar ▸ Admin ▸ Security. Active login lockouts. Unlocking an account restores access immediately.

Administration: Audit Log and License
Audit Log
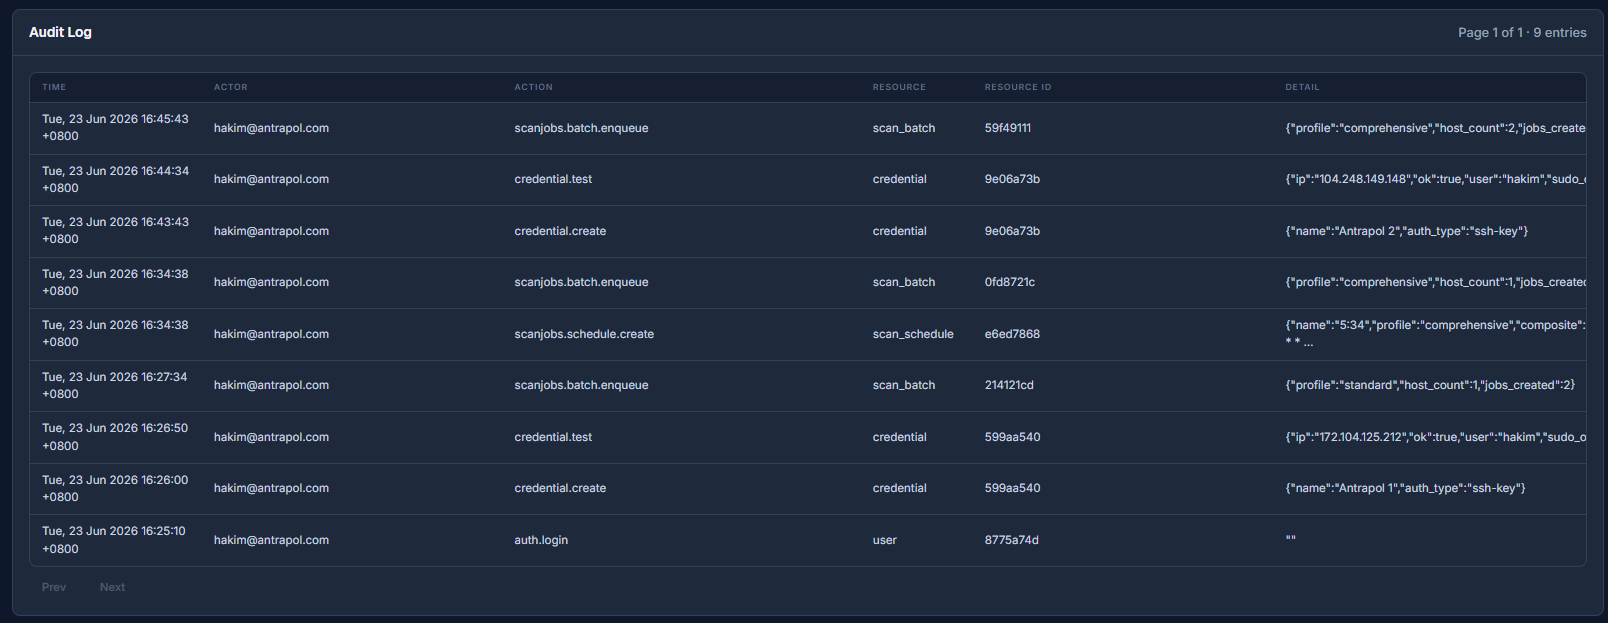
Sidebar ▸ Admin ▸ Audit Log. A tamper-evident record of every significant action.
License
Sidebar ▸ Admin ▸ License. Activation status for this Manage Server instance.
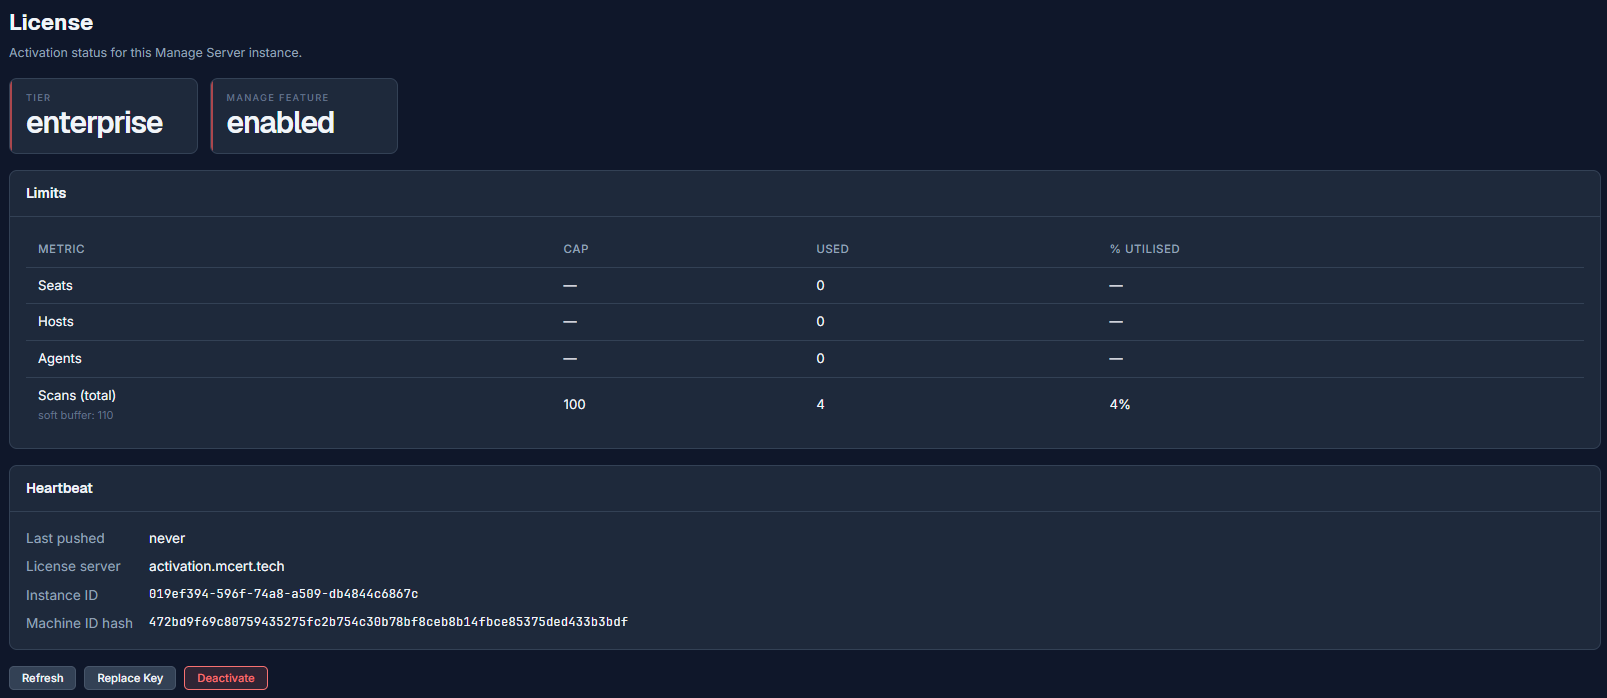
- Tier (for example enterprise) and whether the Manage feature is enabled.
- Limits: seats · hosts · agents and total scans each with a cap · used count and utilisation percentage.
- Heartbeat: last pushed time · license server · instance ID · machine ID hash.
- Buttons: Refresh (re-validate now) · Replace Key (enter a new key) · Deactivate (release this activation).
Administration: Binaries and Settings
Binaries
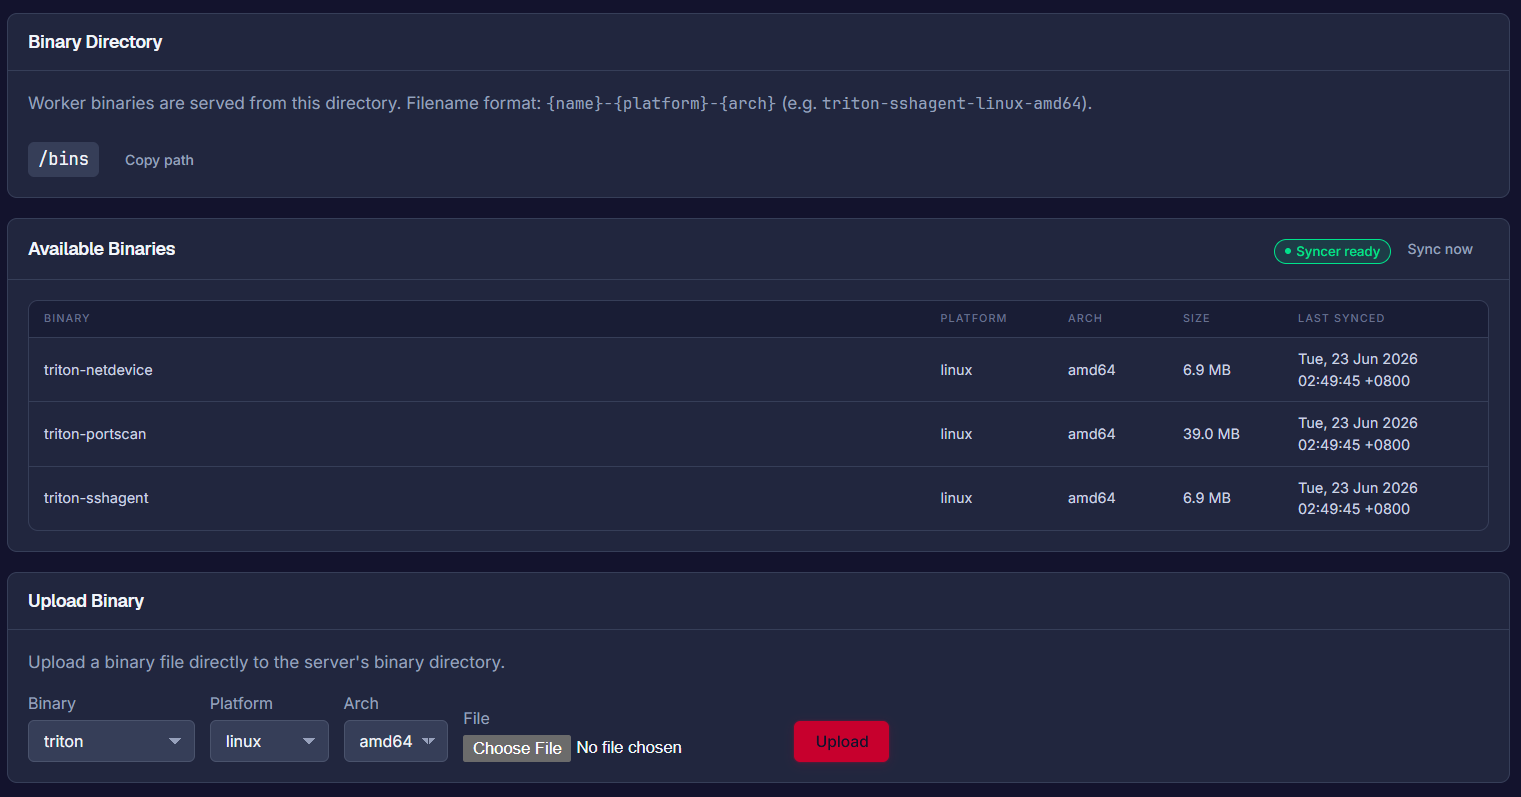
Sidebar ▸ Admin ▸ Binaries. The Manage Server distributes small worker binaries to agents and SSH targets.
-
Binary Directory
is
/binswith filenames in the form{name}-{platform}-{arch}(for exampletriton-sshagent-linux-amd64). Copy path copies it. -
Available Binaries
lists
triton-netdevice·triton-portscan·triton-sshagentand thetritonscanner itself each with a platform and architecture and copyable install URL.
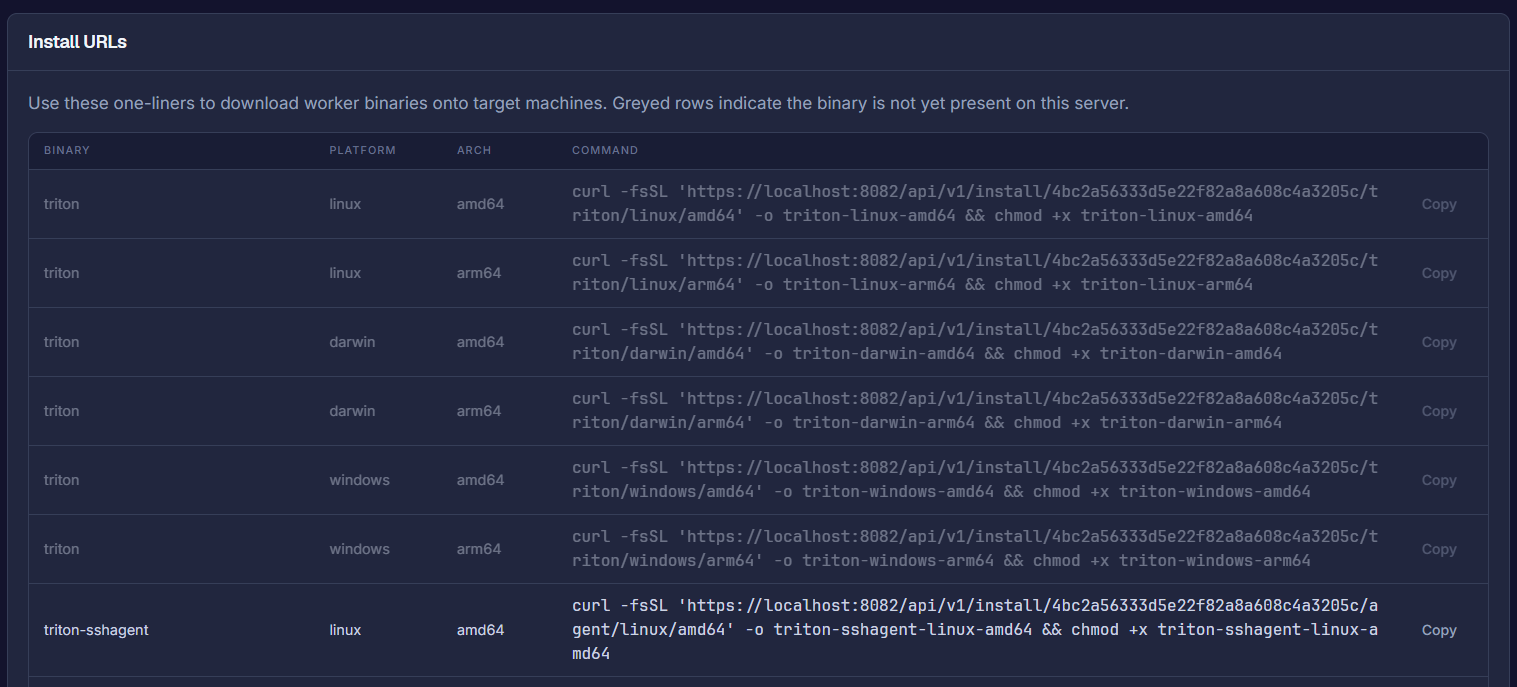
Upload Binary lets you manually supply a binary (binary · platform · architecture then choose a file and upload) for air-gapped sites.
Settings
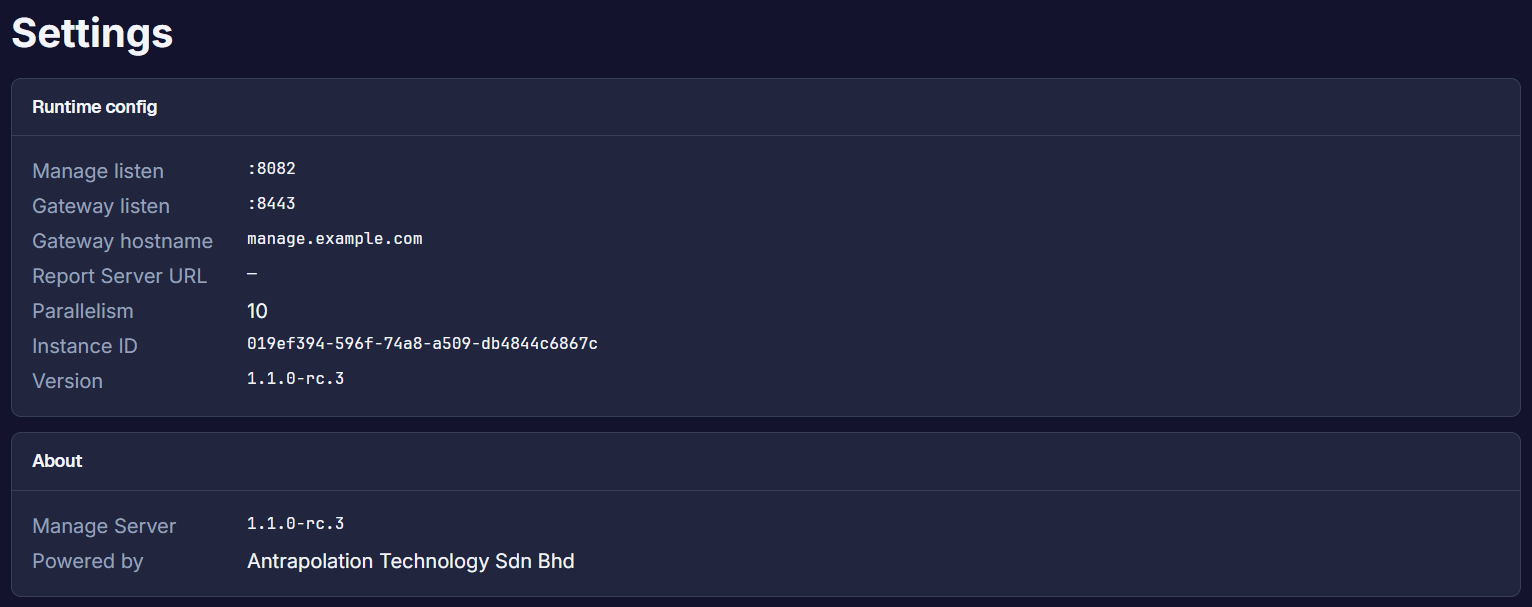
Sidebar ▸ Admin ▸ Settings. Read-only runtime information.
Workflow: scan your first server
- Inventory ▸ Credentials ▸ Add Credential: type SSH Key. Paste the key. Set the username. Add a sudo password if you want full-depth scans. Save to Vault.
- Inventory ▸ Hosts ▸ New host: enter hostname and IP. Pick the credential. Click Test connection and wait for it to confirm. Then Create.
- Operations ▸ Scan Jobs ▸ New Scan: Next choose Standard. Tick your host. Leave it on Run immediately. Leave limits unlimited. Then Enqueue 2 jobs.
- Watch the jobs move from queued to running to completed. A deep SSH scan on a small host typically takes about a minute.
- Reports ▸ Scans: click the scan to read what it found.
Workflow: produce the NACSA Arahan 9 workbook
- Fill in Inventory ▸ Applications with your business systems and their owners.
- Set dates in Planning ▸ Phases (use Fill with template) and figures in Planning ▸ Budget.
- Scan every in-scope host (the workflow above) and tag them
pqc-scope. - Reports ▸ NACSA Arahan 9: review Summary · Inventory · SBOM · CBOM · Risk · Migration and Attribution.
- Click ↓ NACSA Arahan 9 Excel.
Workflow: onboard a host where SSH is blocked
-
Inventory ▸ Hosts ▸ Agents ▸ Enrol agent:
confirm the gateway address is reachable from the target then Enrol and download. Save
the
.tar.gzbundle. - Copy the bundle to the target and run the one-line installer from the guide modal. It needs sudo or Administrator rights.
- The agent appears on the Agents tab. Scan it exactly like any other host.
Reference: status and action and job types
| Status | Action | Deadline |
|---|---|---|
| SAFE | None | N/A |
| TRANSITIONAL | Plan replacement | Before 2030 |
| DEPRECATED | Schedule replacement | Soon |
| UNSAFE | Replace now | Immediate |
| Type | Lens | Credential | Output |
|---|---|---|---|
| Port Survey | Network | None | TLS certs · ciphers · protocol versions |
| SSH / Agent | Deep (inside-out) | SSH key/password or agent | Full crypto inventory |
| Format | Where | Use |
|---|---|---|
| CycloneDX (JSON) | Dashboard · Scan detail | Tool-to-tool CBOM/SBOM exchange |
| SARIF | Dashboard · Scan detail | Code-scanning and DevSecOps pipelines |
| NACSA Arahan 9 (Excel) | Dashboard · Scan detail · NACSA report | Government compliance submission |
Reference: Risk Matrix
Sidebar ▸ Reference ▸ Risk Matrix. Configures the 5x5 Impact by Likelihood grid used to score every algorithm's risk in NACSA Arahan 9 reports. A finding's score is Impact times Likelihood from 1 to 25 and the band that score lands in sets its colour and label everywhere in MCert.
| Score range | Label (EN) | Label (BM) |
|---|---|---|
| 20–25 | Very High Risk | Risiko Sangat Tinggi |
| 15–19 | High Risk | Risiko Tinggi |
| 10–14 | Medium Risk | Risiko Sederhana |
| 5–9 | Low Risk | Risiko Rendah |
| 1–4 | Very Low Risk | Risiko Sangat Rendah |
Likelihood scale (1 to 5): how probable the risk is:
| Level | Label | Description |
|---|---|---|
| 1 | Very Low | Very unlikely; no known occurrence in similar systems. |
| 2 | Low | Unlikely; rarely occurs but has happened before. |
| 3 | Medium | Possible; occasional occurrence in similar systems. |
| 4 | High | Likely; frequent occurrence or an actively exploited class. |
| 5 | Very High | Almost certain; occurs regularly or is a known active threat. |
Impact scale (1 to 5): how severe the consequence is:
| Level | Label | Description |
|---|---|---|
| 1 | Very Low | Minimal impact; no significant disruption to operations. |
| 2 | Low | Minor impact; minor disruption that recovers quickly. |
| 3 | Medium | Moderate impact; some disruption with manageable recovery. |
| 4 | High | Significant impact; major disruption to critical services. |
| 5 | Very High | Critical impact; severe disruption with a possible data breach or loss. |
Reset to defaults
Both the matrix and the scales carry a Reset to Defaults control that restores NACSA's official bands if you have customised them and want to start over.Reference: Risk Register
Sidebar ▸ Reference ▸ Risk Register. Configures the Risk Categories and Root Causes used when NACSA Arahan 9 risk assessments are generated. Categories group findings by the part of the system at fault. Root Causes explain why the risk exists and uniquely carry ready-made mitigation steps.
| Category (EN) | Category (BM) | Definition |
|---|---|---|
| Algorithm Strength | Kekuatan Algoritma Kriptografi | Risks from weak or deprecated or quantum-vulnerable algorithms. |
| Key Management | Pengurusan Kunci | Risks in key lifecycle: storage · rotation and access control. |
| PKI & Digital Certificates | PKI & Sijil Digital | Risks from certificate management · CA trust chains and signature verification. |
| Network & Protocol | Rangkaian & Protokol Kriptografi | Risks from insecure protocol versions · weak cipher suites and misconfigured TLS/VPN/SSH. |
Two examples of a Root Cause with its mitigation steps:
| Root cause | Definition | Mitigation steps |
|---|---|---|
| Algorithm Weakness | Use of algorithms that are weak or deprecated or vulnerable to quantum attacks. | Replace weak or legacy algorithms with a hybrid classical-plus-PQC approach in phases. Prioritise DEPRECATED or UNSAFE algorithms first. Adopt NIST PQC standards (ML-KEM · ML-DSA · SLH-DSA) for new systems. |
| Key Management Weakness | Inadequate key lifecycle management: storage · rotation · access control and destruction. | Cover the full key lifecycle with strict access control. Use an HSM or secure key vault for long-term keys. Enforce automated key rotation with audit logging. |
Reference: Scoring Config
Sidebar ▸ Reference ▸ Scoring Config.
Sets the Impact and Likelihood values MCert auto-fills for every PQC Status by Risk Category
combination so a risk score never has to be entered by hand. Score is Impact times
Likelihood using the scale above and it feeds the 4_RiskAssessment
sheet of the exported Arahan 9 workbook (columns Impak and Kemungkinan).
| PQC Status | Algorithm Strength | Key Management | Certificate / PKI | Transport / Protocol |
|---|---|---|---|---|
| SAFE | I1×L1=1 | I1×L2=2 | I1×L1=1 | I1×L1=1 |
| TRANSITIONAL | I2×L3=6 | I3×L4=12 | I3×L3=9 | I3×L3=9 |
| DEPRECATED | I4×L4=16 | I4×L5=20 | I4×L4=16 | I4×L5=20 |
| UNSAFE | I5×L5=25 | I5×L5=25 | I5×L5=25 | I5×L5=25 |
Why this matters
Scoring is configured per status and category and not per algorithm. Change one number here and every matching finding across your whole inventory is re-scored the next time a NACSA report is generated.Reference: Crypto Map
Sidebar ▸ Reference ▸ Crypto Map. A read-only registry of every algorithm and protocol MCert recognises pulled from the scanning engine itself. You cannot edit it here. It exists so you can look up what a Category or Primitive or Function label in a scan result actually means. In effect it is the full list of what MCert supports.
| Category | Primitive | Function | Algorithm | Key length |
|---|---|---|---|---|
| Symmetric | Encryption | Block cipher | AES-256 | 256 |
| Symmetric | Encryption | Block cipher (deprecated) | 3DES | 168 |
| Symmetric | Encryption | Stream cipher (unsafe) | RC4 | 40–2048 |
| Symmetric | Hashing | Hash function (PQC-safe) | SHA3-256 | 256 |
| Symmetric | Hashing | Hash function (unsafe) | MD5 | 128 |
| Asymmetric | Digital Signature | Signature (PQC · NIST standard) | ML-DSA-65 | 1952 |
| Asymmetric | Digital Signature | Signature (PQC) | Falcon-512 | 897 |
| Asymmetric | Key Exchange | KEM (PQC · NIST standard) | ML-KEM-768 | 1184 |
Protocols map to the algorithm suite they typically negotiate. A finding of "TLS 1.0" traces straight back to the weak algorithms that made it UNSAFE:
| Protocol | Typical algorithms |
|---|---|
| TLS 1.3 | AES-128-GCM · AES-256-GCM · ChaCha20-Poly1305 · X25519 · ECDSA-P256 · Ed25519 · ML-KEM-768 (hybrid) |
| TLS 1.2 | AES-128-GCM · AES-256-GCM · ECDHE-RSA · ECDHE-ECDSA · SHA-256 · SHA-384 |
| TLS 1.1 | AES-128-CBC · 3DES-EDE-CBC · SHA-1 |
| TLS 1.0 | AES-128-CBC · 3DES-EDE-CBC · MD5 · SHA-1 |
| IPSec / IKEv2 | AES-256-GCM · AES-128-GCM · SHA-256 · SHA-384 · ECDH-P256 · ECDH-P384 |
| SSH (OpenSSH) | AES-256-CTR · AES-128-CTR · ChaCha20-Poly1305 · Ed25519 · ECDSA-P256 · RSA-4096 |
| WireGuard | ChaCha20-Poly1305 · X25519 · BLAKE2s |
| OpenPGP / GPG | AES-256 · RSA-4096 · ECDSA-P256 · Ed25519 |
| S/MIME | AES-256 · RSA-2048 · ECDSA-P256 · SHA-256 |
Troubleshooting
| Symptom | Cause and fix |
|---|---|
| "Scan jobs disabled, HTTPS required" banner | The portal is on plain HTTP. Reconnect over https:// and accept the certificate once. |
| Browser warns "Your connection is not private" | That is the self-signed CA. Click Advanced then Proceed or import the server's CA into your trust store. The certificate is valid for localhost and 127.0.0.1. |
| Deep SSH scan fails at "5/6 Scanning remotely" (sudo / exit status 1) | The deep scan needs sudo but no sudo password is stored and the user lacks passwordless sudo. Add a Sudo Password to the credential or grant the SSH user NOPASSWD sudo. |
| Connection test warns "Sudo: password required" | The scan will skip root-only files. Same fix as above for full coverage. |
| Host Test connection times out | Wrong IP or port or a firewall or SSH not listening. The SSH port must be reachable from the Manage Server and the server's source IP may need allow-listing on the target's firewall. |
| Jobs stay queued and never run | The scanner pipeline is not healthy (check the sidebar pill or Check now) or worker binaries failed to sync. See Admin ▸ Binaries and upload them manually for air-gapped sites. |
| Agent never appears on the Agents tab | The gateway address was not reachable from the target often because it was left as localhost. Re-enrol with the server's real LAN address. |
| License shows the wrong tier or limits | Admin ▸ License ▸ Refresh to re-validate. |
This guide is produced from a live MCert installation and a real Standard-profile scan of a Linux host. Questions this guide does not answer are usually fastest solved by a demo request so we can walk your specific environment together.